
 E-mail
 Print
Print facebook
 twitter
 Linkedin
 google+
List of Symbols
AM
Additive Manufacturing
DOE
Design of Experiment
SLS
Selective Laser Sintering
FEM
Finite Element Method
GA
Genetic Algorithm
FBCCZ
Face and Body Centred Cubic with Vertical Struts
BCCZ
Body Centred Cubic with Vertical Struts
BCC
Body Centred Cubic
FDD
Face Centred Cubic
OC
Octet-cubic
FBCC
Face-body Centred Cubic
CC
Combined Cell
NSGA II
Non-dominated Sorting Algorithm II
ANOVA
Analysis of Variance
FDM
Fused Deposition Modeling
Sl
Surface Lattice Thickness
C
Volume Lattice Cell Size
Sk
Skin Thickness
1 Introduction
Although additive manufacturing (AM) or 3D printing has been around for quite a while, it has been more recently that industries have been considering it more seriously for manufacturing as it allows for more innovative and customized solutions from the automotive to medical aerospace industries [1–3].
The design of parts has been largely constrained due to the manufacturing limitation of traditional manufacturing. With AM, the parts can be mass customized with little restriction on the design. The aim is to use as little material as possible while meeting the key requirements of the component. With lesser material, a lighter part can be obtained, and this is important for the aerospace or automotive industry as these mass savings could translate to cost savings while even enhancing the performance of the part. A study by Ricardo reported that the combined fuel economy increases by 0.15% for every 10 pounds removed from a car powered by gasoline [4]. This is even more pronounced in the aerospace industry where the cost savings could result in thousands of dollars [5]. The finite element method (FEM) has also been used to investigate the structural properties of complex designs. These complex designs usually consist of lattice structures or cellular structures. FEM has shown to be an effective tool to analyse and predict the mechanical behaviour of these lattice structures. FEM is commonly used in the investigation of compressive properties and energy-absorbing properties. With the ability to create complex products, AM enables the creation of customized products. This breaks away from traditional manufacturing methods where parts were produced for the masses with little to no customization.
These lattice structures not only make the part look unique, but also serve to reduce the overall mass of the part. Previous literature has performed optimization studies and various other processing studies. Many papers have also investigated the advantages of lattice structures. However, most of these papers have been largely focused on characterizing or developing a new form of lattice structures. For example, natural frequency is an important aspect of components that becomes vital, especially in the automotive industry where parts are subjected to external forces which can excite them to their natural frequency. If this level is reached, the component will be affected structurally. However, very few research has investigated on the influence of lattice structures on the natural frequency of components.
In this research, the objective is to propose a framework for determining a 3D printed lattice structure to satisfy functional requirements using the design of experiments (DOE) and multi-objective optimization. In the proposed framework, a lattice topology is used to determine the design parameters of the selected lattice based on static compression simulations. The design parameters of the selected lattice are investigated based on the predefined design requirements. DOE is conducted to understand the relationship between the design variables and the responses. A genetic algorithm (GA) is applied to obtain a set of solutions from a compromised final design. A case study is used to demonstrate the usefulness of the proposed framework involving a cubic part and selective laser sintering (SLS) printing process.
The remaining sessions of this paper are organized as following: Section 2 provides relevant literature review on lattice strictures and design optimization in AM. Section 3 explains an overview of the proposed framework. Experiment results and discussion are presented using a case study in Sections 4 and 5. Section 6 discusses the closing remarks and future work.
2. Literature Review
2.1 Lattice Structures
Gibson and Ashby defined lattice structures in 2 main categories 2D (honeycomb) or 3D (foams due to cell walls having random orientations in space) cellular structures [6]. However, this is not a strict classification, and no unified concept of lattice structures exists. This is due to the unrestricted nature of lattices which are not just bound by strut sizes or connection methods between the cells. In general, lattice structures are accepted as 3D structures that consist of repeatedly arranged interconnected cells in a 3D space. One example would be Tao’s definition which only highlights periodic 10 lattice cells and ignores the aperiodic lattice cells [7]. Furthermore, recent papers have delved into gradient lattice structures which cannot be categorized into periodic or aperiodic cells. Random lattice structures are ones where the struts of the lattice do not follow any specific shape or pattern. Periodic lattices are constructed by repetitive placement of struts (equidistance) within a cell. In a graded lattice structure, the cell topology is the same across the same step but varies between the steps [8].
Lattice structures can be evaluated by several different tests. Common investigation methods include tensile tests, bending tests and compression tests [9]. Leary investigated the mechanical properties of 5 different lattice structures (Face and body centred cubic with vertical struts (FBCCZ), Face centred cubic with vertical struts (FCCZ), Body centred cubic with vertical struts (BCCZ), Body centred cubic (BCC), and Face centred cubic (FCC)) which involved extensive compression testing [10]. It was found that the BCC lattice showed the least absolute compressive strength and moduli as compared to other lattices such as FCCZ and FBCCZ. The poor compressive strength and moduli of the BCC lattice were correlated to the absence of struts in the direction of loading and low density. Functionally graded lattices were also investigated by using a general optimization formulation which was stiffness-based [11]. Octet-cubic (OC), Face-body centred Cubic (FBCC) and Combined cell (CC) designs were optimized and investigated by applying the lattice structures on a rectangular beam which must carry a static bending load. The graded lattices performed much better as compared to uniform lattice structures based on specific energy absorption even after the stiffness optimization process. Abate performed compression mechanical testing and performed FEA of six different lattice structures using the polyjet 3D printing process [12]. Both FEA and experiments of 11 compression were found to be in agreement, and it was found that the unit cell size had the most profound effect on the compressive stress and performance. Song investigated a novel compression-resistant polymer lattice and lattice composite guided by topology optimization method [13]. It was found that the resultant structure underwent a compressive behaviour of buckling-to-brittle process. The composite structure had a relatively high specific compressive modulus and an energy absorption efficiency of 78%. Ozdemir conducted quasi-static analysis on 3 different lattice cells (cubic, diamond and reentrant) to obtain the dynamic load deformation behaviour, stress-strain response, and failure process of the lattices [14]. The lattice structures showed distinct differences in deformation behaviour and energy absorption effect under low-speed and high-speed collision. Thus, the focus of lattice structures has been largely on the reduction of mass while maintaining the part’s strength, mainly in the form of compression and energy absorption. Many parts must often operate under dynamic conditions. Under dynamic conditions, the natural frequency of components become an important factor to consider.
2.2 Lattice Structure Optimization in AM
Guo performed vibration tests using a shaker table on a cantilever sandwich beam with an hourglass truss structure in the core. 3 Samples of size 180 × 24 × 12 mm were fabricated from polylactic acid using the fused deposition modeling (FDM) process [15]. The vibration experiment was performed on a cantilever beam with a shaker table. Experiments were found to have good agreement with simulation results of the natural frequency. The developed theoretical model also matched well with the aforementioned. Wang noted that frequency is important in components such as wind turbine blade which experience dynamic loads [16]. A cantilever plate was optimized computationally to consist of lattice structures with varying densities. FEA and the experiments were shown to be in good agreement. The final design had a natural frequency that was 30% higher without any increase in mass as compared to the homogenous lattice structure. Similarly, Cheng was able to maximize the first eigenfrequency by using variable density lattice structures [16]. This was demonstrated on a 15 × 15 × 120 mm cantilever beam. The lattice type used in the work was cubic in nature with voids in between them.
Bin Azmi investigated into the vibration analysis of a lattice structure bar manufactured by varying the print strength parameter of the FDM printing process and the BCC lattice structure [17]. 2 samples of lattice structure were printed in the solid and almost solid print strength. The vibration experiment was performed by clamping the specimen on one end and by using a shaker table. And the heavier sample (solid) was found to have a higher frequency. Bin Azmi also investigated the effect of strut radius on the natural frequencies of acrylonitrile butadiene styrene BCC lattice bar printed using the FDM method [18]. The research found that a larger radius of strut resulted in higher natural frequencies due to higher stiffness which makes it suitable in automated devices. Modal analysis of a simple lattice structure was also investigated by Monkova where 5 same samples were printed from ABS using the FDM process [19]. A simple BCC cell contained within a cube of size 42 × 49 × 56 mm was used to obtain the first 5 natural frequencies. The natural frequencies obtained by experiment were found to be lower than those obtained by simulation in most cases. Simsek used the direct metal laser melting of HS188 to fabricate triply periodic minimum sandwich lattice structures to investigate on the effect of plate and gyroid wall thickness on the natural frequencies of the part [20]. The printed part was 192 × 192 × 25.6 mm and the vibration experiment was performed using an impact hammer and by hanging the plate freely from cables. The experimental and simulation results were in good agreement. Satellite structures containing lattice sandwich panels were also fabricated using the selective laser melting method with AlSi10Mg powder [21]. Pyramidal lattice cells of size 5 × 5 × 5 mm in most regions and half that in local regions for better connections. Frequency experiments were performed by applying loads in horizontal and vertical axis successively. The satellite structure with pyramidal lattice structure was found to be superior to the traditional aluminium honeycomb sandwich panels as it had better structure weigh to satellite mass ratio with no degradation in eigenfrequencies. Wang investigated into the vibration damping and natural frequency of composite Kagome truss sandwich panels with viscoelastic material filing [22]. The filling material was thermosetting polyurethane. The lattice structure was printed of PA6 using the SLS method and the natural frequency was obtained by using impact hammer testing. The solid plate had much higher natural frequencies as compared to those of the Kagome plates. It was noted that the viscoelastic material filling has potential for bandgap design. Syam adopted the SLS printing method to fabricate PA 12 strut-based lattice structures for the purpose of vibration isolation [23]. 6 different lattice models were investigated with a dimension of 50 × 50 × 50 mm. Only 3 models (2 of each) were printed for validation. Vibration experiments were obtained by using an impact test with an accelerometer. The type of lattice had significant influence on the natural frequency. The model with the lowest natural frequency but with the highest structural integrity criteria is chosen for the purpose of vibration isolation.
Various methodologies for achieving design goals are presented. Khodaygan and Golmohammadi used a new combined meta-modeling, non-dominated sorting algorithm II (NSGA II), and technique order of preference by similarity to ideal solution for a multi-criteria optimization formulation for AM [24]. The investigated response was part build orientation (PBO) by incorporating build times and surface roughness as its objective functions. Alizadeh used NSGA II and technique order of preference by similarity to ideal solution to obtain a compromised optimal solution for AM process parameter setting for fused filament fabrication processes [25]. The investigated parameters included printing speed, extrusion temperature and layer thickness, while the responses of interest were energy consumption and part geometrical accuracy. Tian conducted a similar study with the same responses and parameters but used the Karush-Kulhtucker (KKT)-based nonlinear programming optimization to achieve design goals [26]. Sood, Ohdar, and Mahapatra investigated the 3 mechanical properties of FDM parts: tensile, flexural and impact strength [27]. The investigated parameters included raster angle (RA), LT, PBO, raster-to-raster air gap (RRAG) and raster width (RW). A response surface methodology using the central composite design and analysis of variance (ANOVA) was conducted for the validity of the models. In a study by Barrrionuevo and Ramos-Grez, tensile strength was optimized by investigating printing speed, infill density, LT, and RA [28]. This was done by using a combination of adaptive neuro-fuzzy inference system and ANOVA. Peng investigated on optimization of warp, dimensional errors, and build time by adopting a response surface methodology and fuzzy inference system using 17 uniform arrays [29]. The parameters investigated in this study were print speed, LT, feed rate, RW and compensation factor. Liu investigated on the optimization of compressive strength and impact strength by using Gray relation and the Taguchi method [30]. The parameters of interest for the study were PBO, LT, RA, RW, and RRAG. Padhi adopted the L27 Taguchi method and the fuzzy interference system to optimize the dimensional accuracy (length, width, thickness) of printing [31]. The input parameters investigated are LT, PBO, RA, RW, and air gap (AG).
Many papers have been published on the advent of AM and its ability to print complex designs. However, most of the papers focused on the characterization of the lattice structures by highlighting the energy-absorbing abilities and compressive properties. However, for an example, when incorporating the lattice structures to a functional part in an automobile, other requirements such as modal frequencies must be satisfied. Literature survey shows that most vibration analysis on AM parts have been performed on FDM printed parts. Very few research has been performed with respect to the combination of different lattice types with the SLS printing method. The specimen used in various research also differs on a case-by-case basis with the most popular lattice choice being the BCC lattice structure.
3 Proposed Framework
3.1 Framework Overview
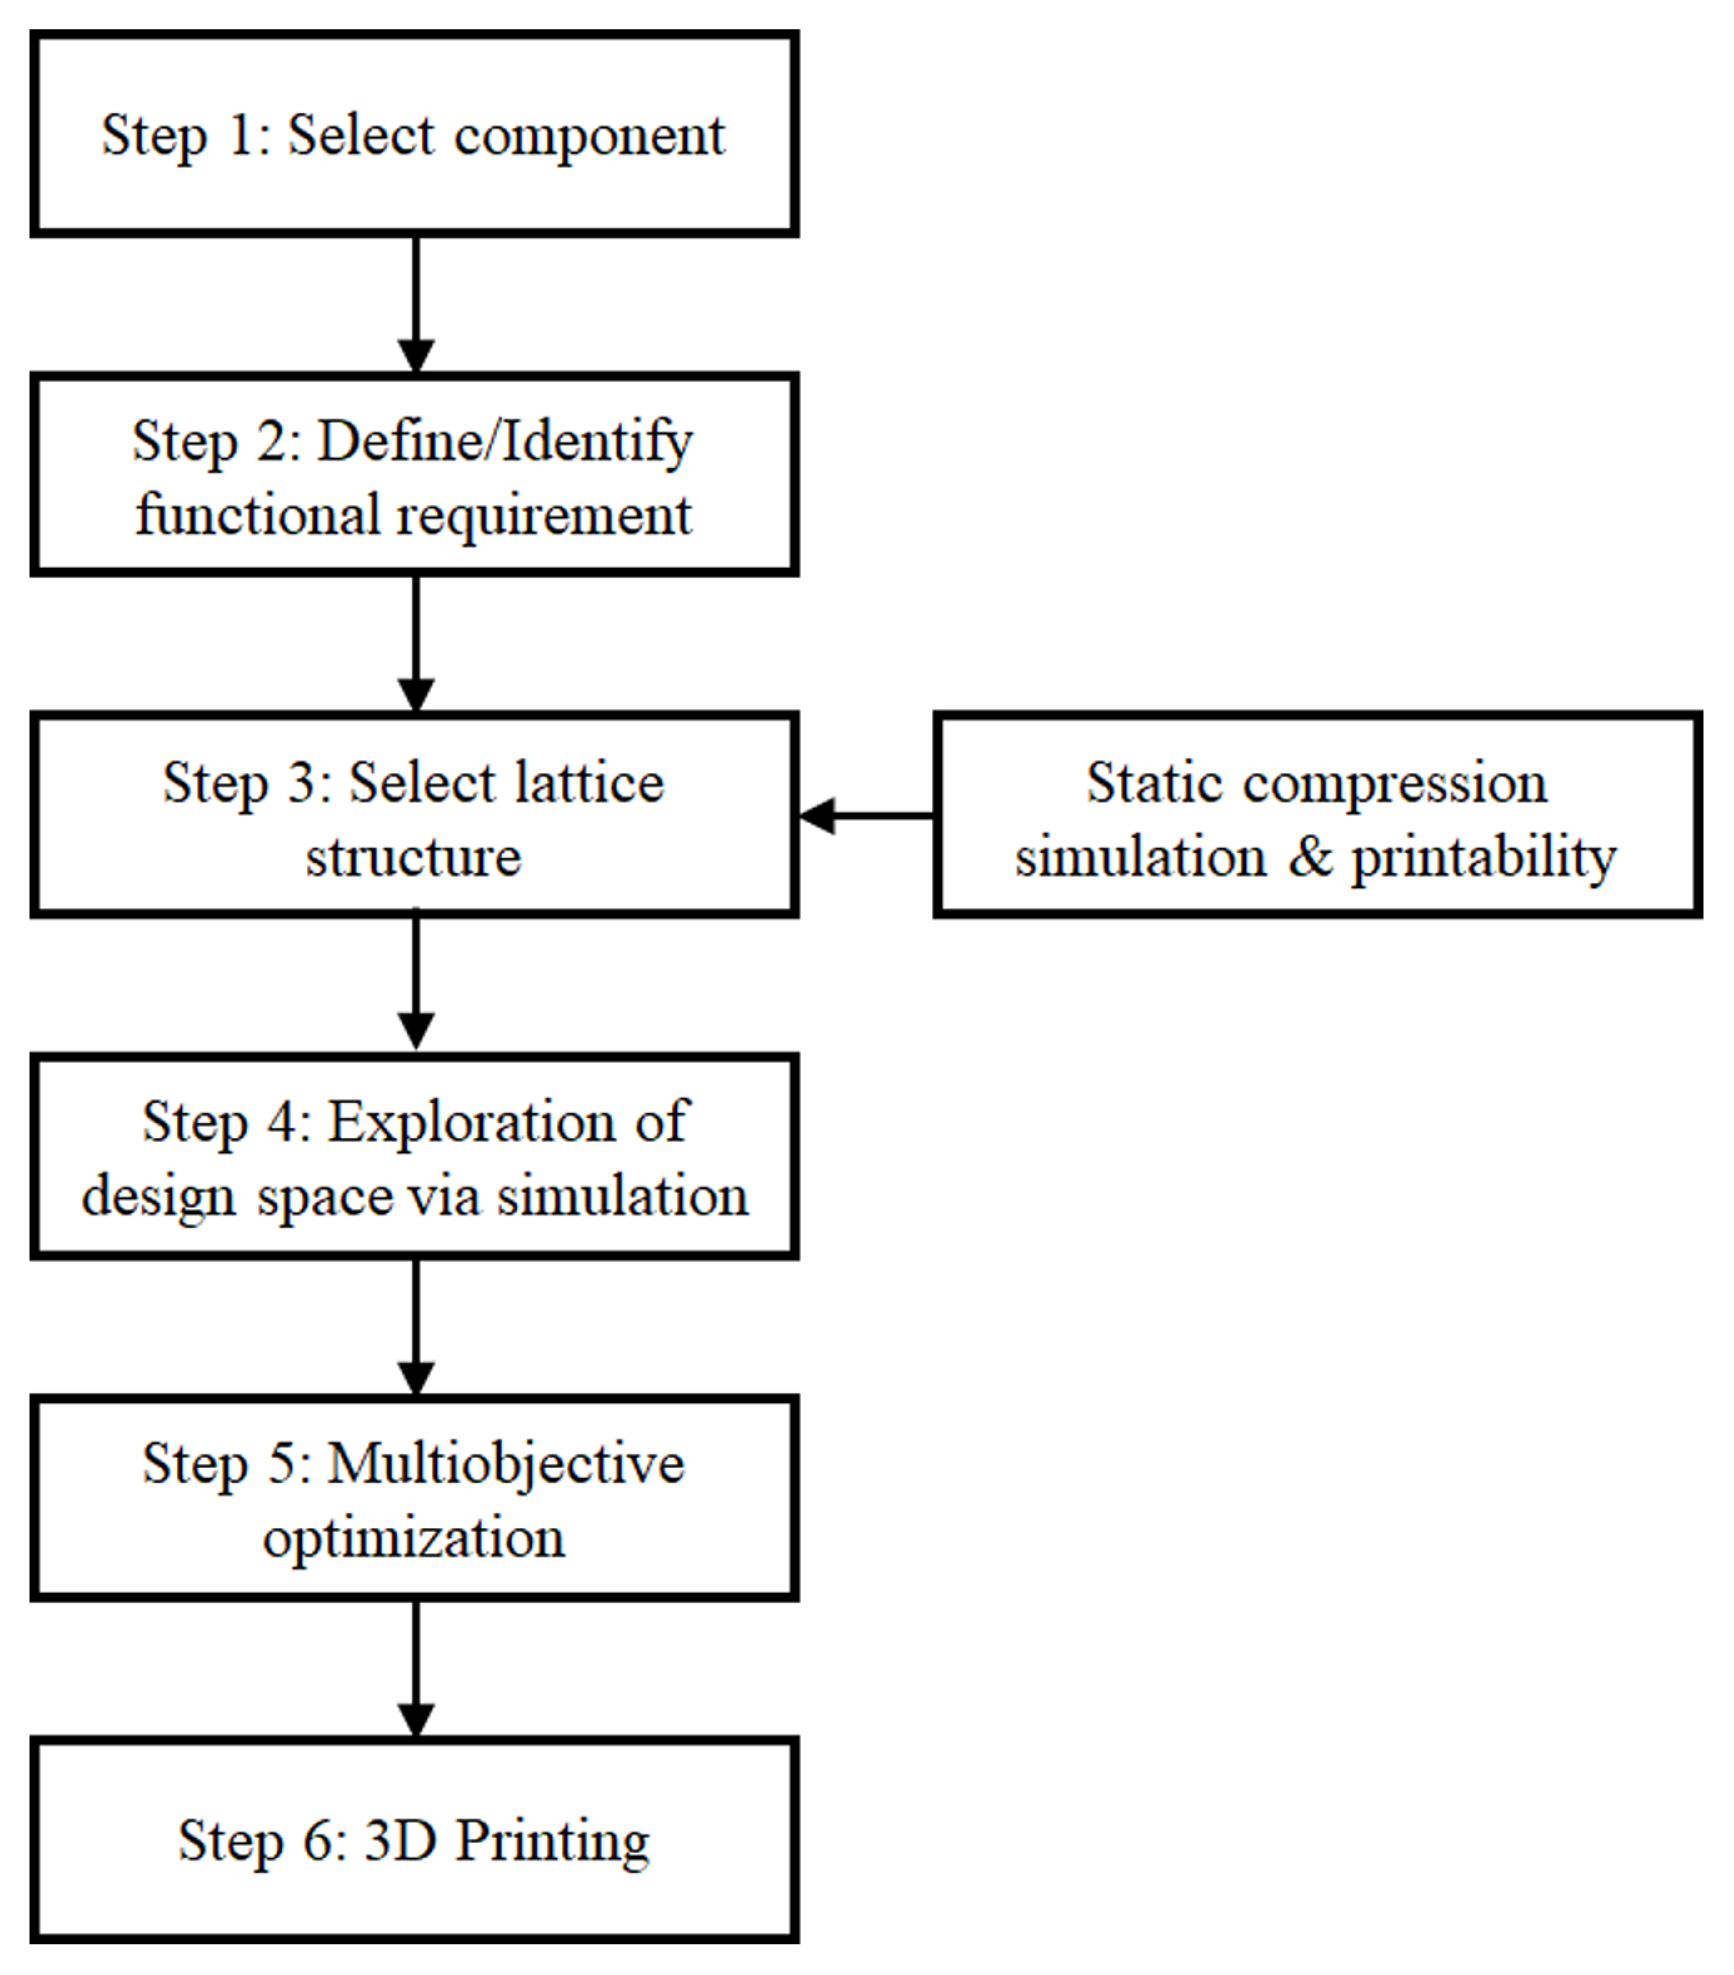
A framework is proposed to determine a 3D printed lattice structure based on the optimization of the selected lattice design. A part is selected and functional requirements are identified. A lattice structure is selected by performing static compression simulations. The CAD model of the component with the lattice structure is then imported into an FEA. Design parameters are changed, and the corresponding simulation results are used in a DOE. As shown in Fig. 1, the proposed design framework consists of 6 Steps: (1) Select component, (2) Define/Identify functional requirements, (3) Select lattice structure candidates, (4) Exploration of design space via simulation, (5) Multiobjective optimization and (6) 3D Printing. In Steps 1 and 2, the most important step before applying any lattice structure is to import the component requirements. However, components and lattice structures have a close relationship. For effective latticing of a structure, it is vital that the part has sufficient thickness to allow the lattices to fully form. Thus, the selected part must have a reasonable thickness for the lattices. Once the component is selected, the necessary functional requirements are identified. In Step 3, to select lattice structures, it is important to identify the minimum cell size that can be printed while keeping the distinct features of the lattice. This must be achieved by creating multiple sizes of the lattice structure and printing them to observe which definition works best. A general guideline is that the lattice cell size must be smaller than the thickness of the chosen part. However, if the cell size is too small, the lattice will not be created distinctly. In conjunction with printability, FEA is used to aid in the final lattice selection from a select few. Once the lattice structure is selected and incorporated as intended to the part in Step 4, a DOE is conducted to understand the relationship between the design variables and the responses. The responses are obtained from the simulation of the final part. The design variables can be the lattice definitions or part definitions. In Step 5, an empirical equation is obtained from DOE ANOVA. The equation describes mathematically how the inputs and responses are linked. This equation is then used for the purpose of multiobjective optimization. Step 6: Based on the DOE table, the selected parts are 3D printed to simple compare experimental results to their simulation counterparts. In this paper, the details of Step 3 are explained using a case study in Section 4.
3.2 DOE and Multiobjective Optimization
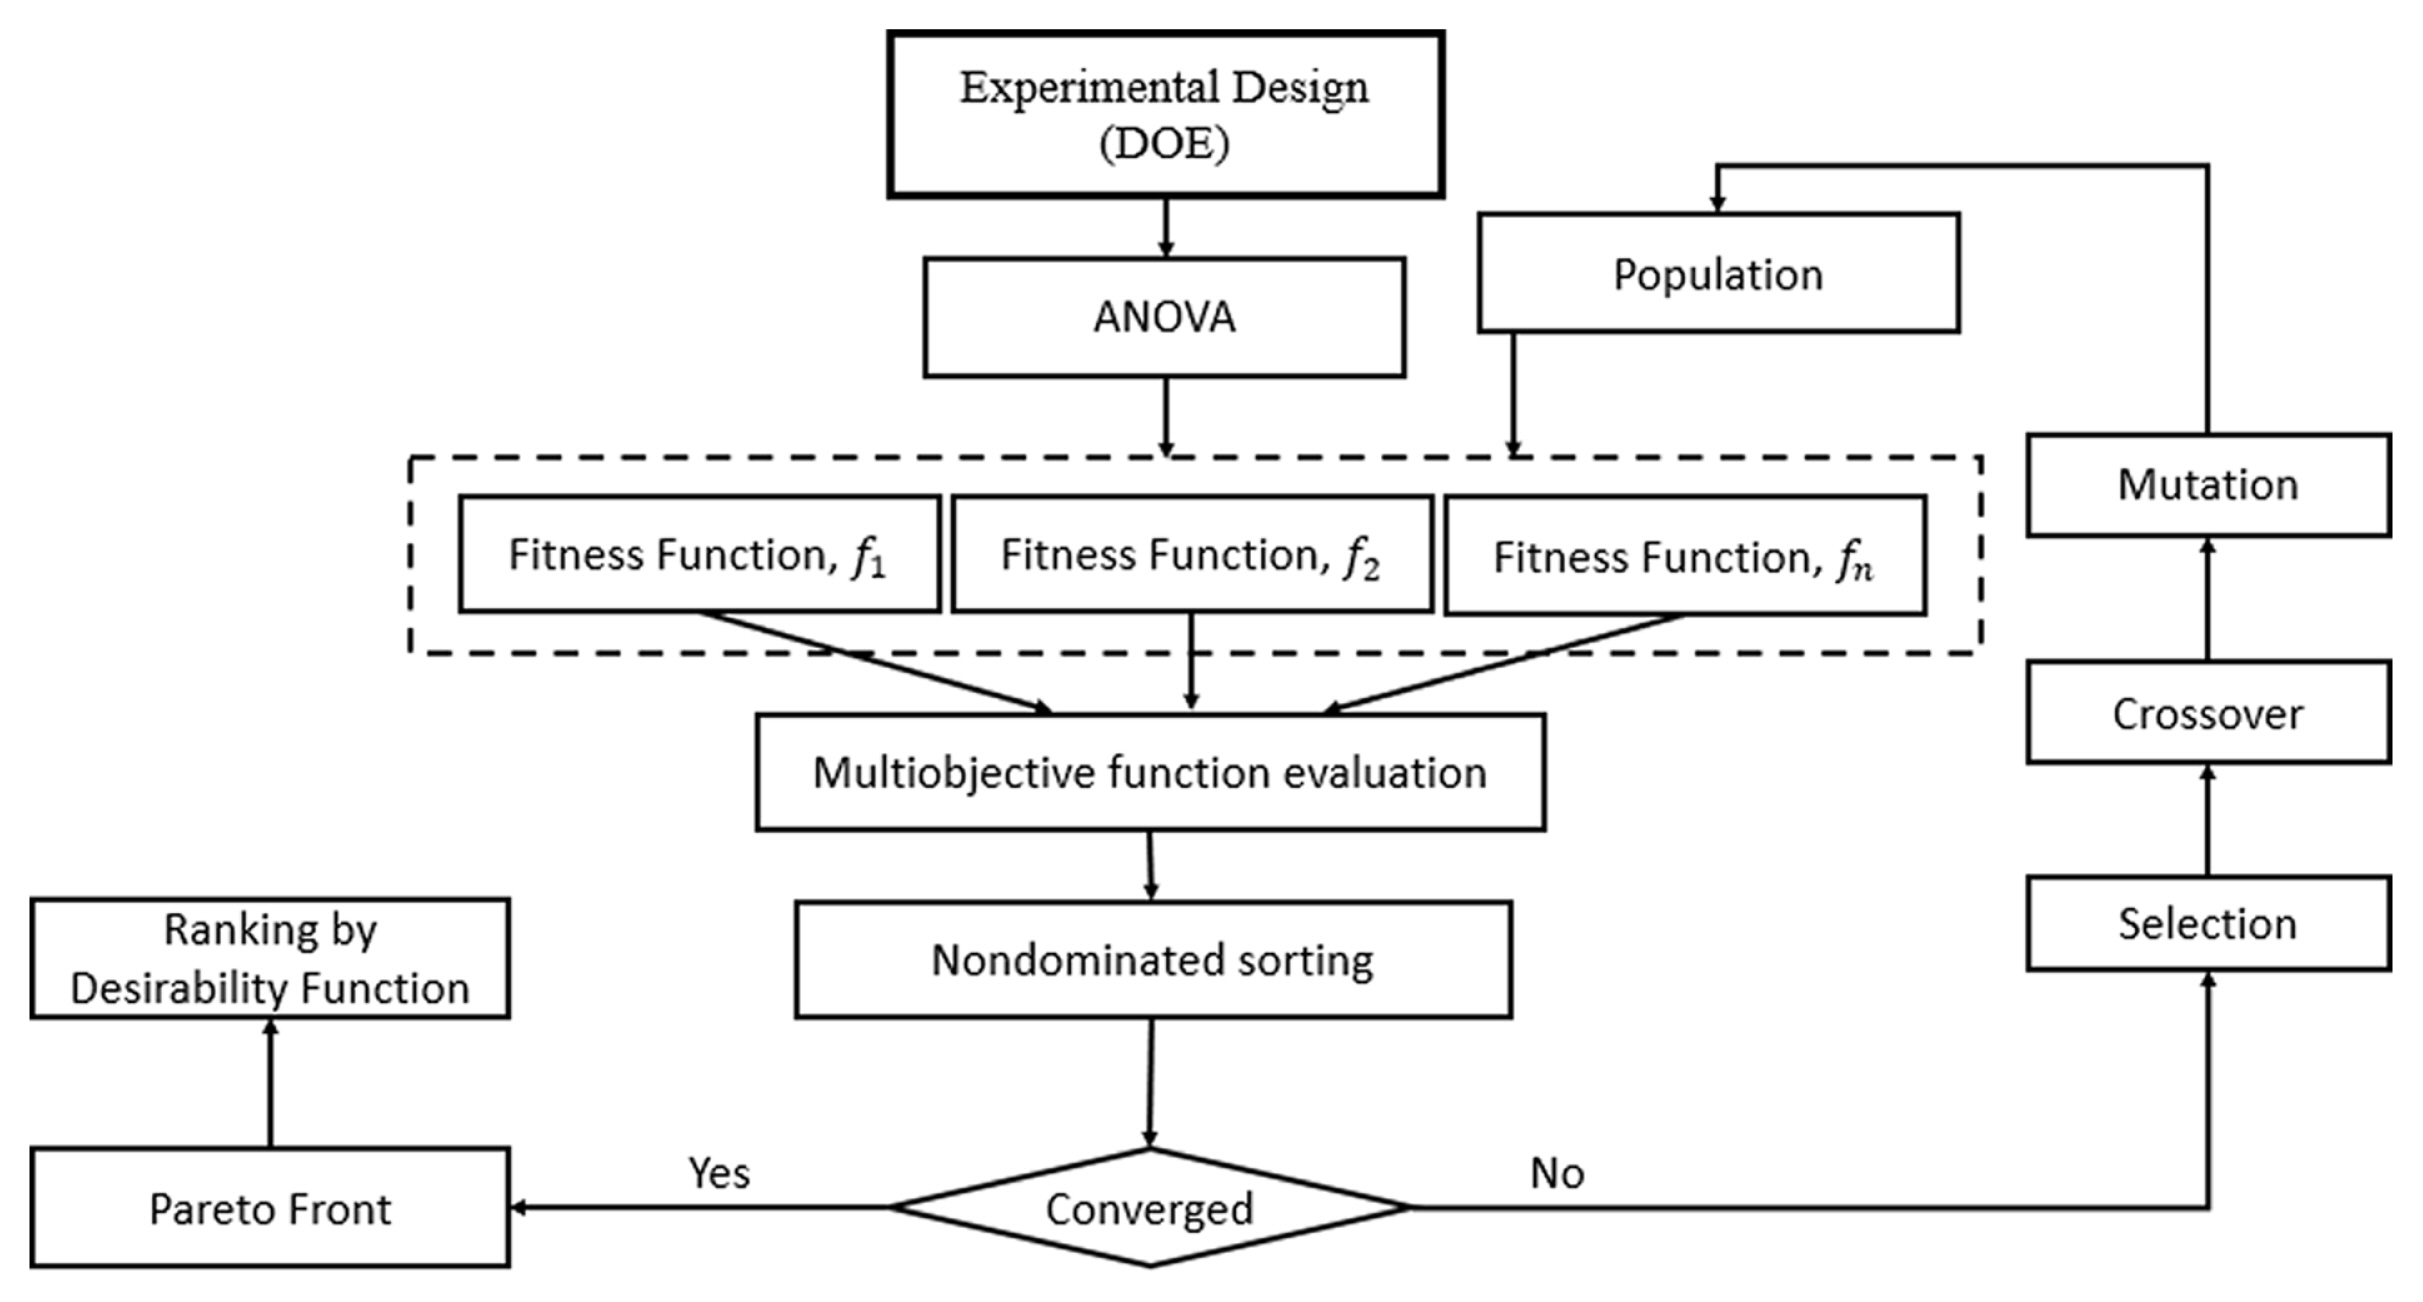
DOE and multiobjective optimization processes in Steps 4 and 5 are proposed as shown in Fig. 2. The optimization starts by performing a DOE analysis and inserting the results into a multiobjective function. With the available solutions as obtained from the multiobjective optimization, the desirability function is used to rank the solutions.
DOE is a powerful mathematical tool to determine the relationship between factors affecting a system and the output of the system. DOE can be applied to many different systems such as process characterization, evaluation of material properties, product design and component tolerance determination. To analyse the results from the DOE, an ANOVA is performed to investigate how the factors influence the system. In ANOVA, two key parameters that are used to evaluate the significance of the DOE model and individual factors. The parameters are P-value and F-value. The P-value is the probability of achieving the F-value. A small P-value indicates that the factor is statistically significant while a high F-value indicates that the variation in the model is larger than the process. In this research, a full factorial DOE is conducted, and an equation of the DOE model is obtained from ANOVA. The equation is then used for the multiobjective optimization.
Multiobjective optimization is used when more than one objective function is to be optimized simultaneously. The most popular form of multiobjective optimization is the evolutionary algorithm (EA). EA simulates natural evolution by creating a population of individuals, evaluating their fitness, generating a new population through genetic operations, and repeating this process many times. In this research, the non-dominated sorting genetic algorithm III (NSGA-III) is used to optimize conflicting responses in an objective manner [31]. NSGA-III can identify a set of Pareto optimal points that are well distributed by using a reference-point-based method to ensure population diversity. These points are shown visually on a Pareto front.
Results from the NSGA-III can be ranked by using a desirability function. The desirability function is used to reflect the desirable range for the response. The goal to be achieved can range from 0 to 1. The objective of the desirability function is to maximize the overall value of the final desirability value. The objectives (yi) are converted into individual desirability function di. If yi is most desirable, di = 1 and di = 0, and vice versa. To maximize the responses, the higher-the-better approach is used for desirability. For a response that is a maximization type, such as frequency:
To minimize the responses, the lower-the-better approach is used. Thus, for a response that is a minimization type, such as mass:
where r is the individual mass parameter. T and L are the lower and upper limits of the related responses.
Once the desirability of each objective is achieved, the overall desirability can be found by combining them as follows:
where n is the number of responses in the study. In this case, n = 2. In this research, desirability function is used to rank the solution of the GA.
4 Case Study
4.1 Experiment Setup
For a case study, various lattice designs are selected to maximize the natural frequency and minimize the mass on 3D printed parts.
From literature reviews, most of parts used for the demonstration had a thickness of at least 5 mm to accommodate for the inclusion of lattice structures. Hence, a simple shelled cubic model of 50 × 50 × 50 mm and a thickness of 5 mm was used for a case study.
3 volume lattices were chosen as possible candidates to apply in the cubic model of 50 × 50 × 50 mm and a thickness of 5 mm: Grid, X, and Hexagon. The Grid and X (commonly referred to as BCC in literature) lattices were chosen as they had been commonly used in literature. The Hexagon lattice was chosen because the Hexagon lattice was more complex than the traditional ones in comparison. To generate the lattice structures, the thickness of struts was fixed at 1mm. This allowed for the printed lattice structure to be of sufficient stiffness. Through printing of the various lattice types, it was found that the minimum lattice cell size suitable was 4 mm.
The SLS System (Sinterstation HiQ, Stratasys, USA) was used for the 3D printing of various case study parts and Polyamide 11 (PA11; Rilsan® Invent Nat, Arkema Inc., USA) was used for the part material. The material had Young’s modulus of 1600 MPa and an isotropic elasto-plastic material model was used for simulation purposes.
4.2 Select a Lattice Structure
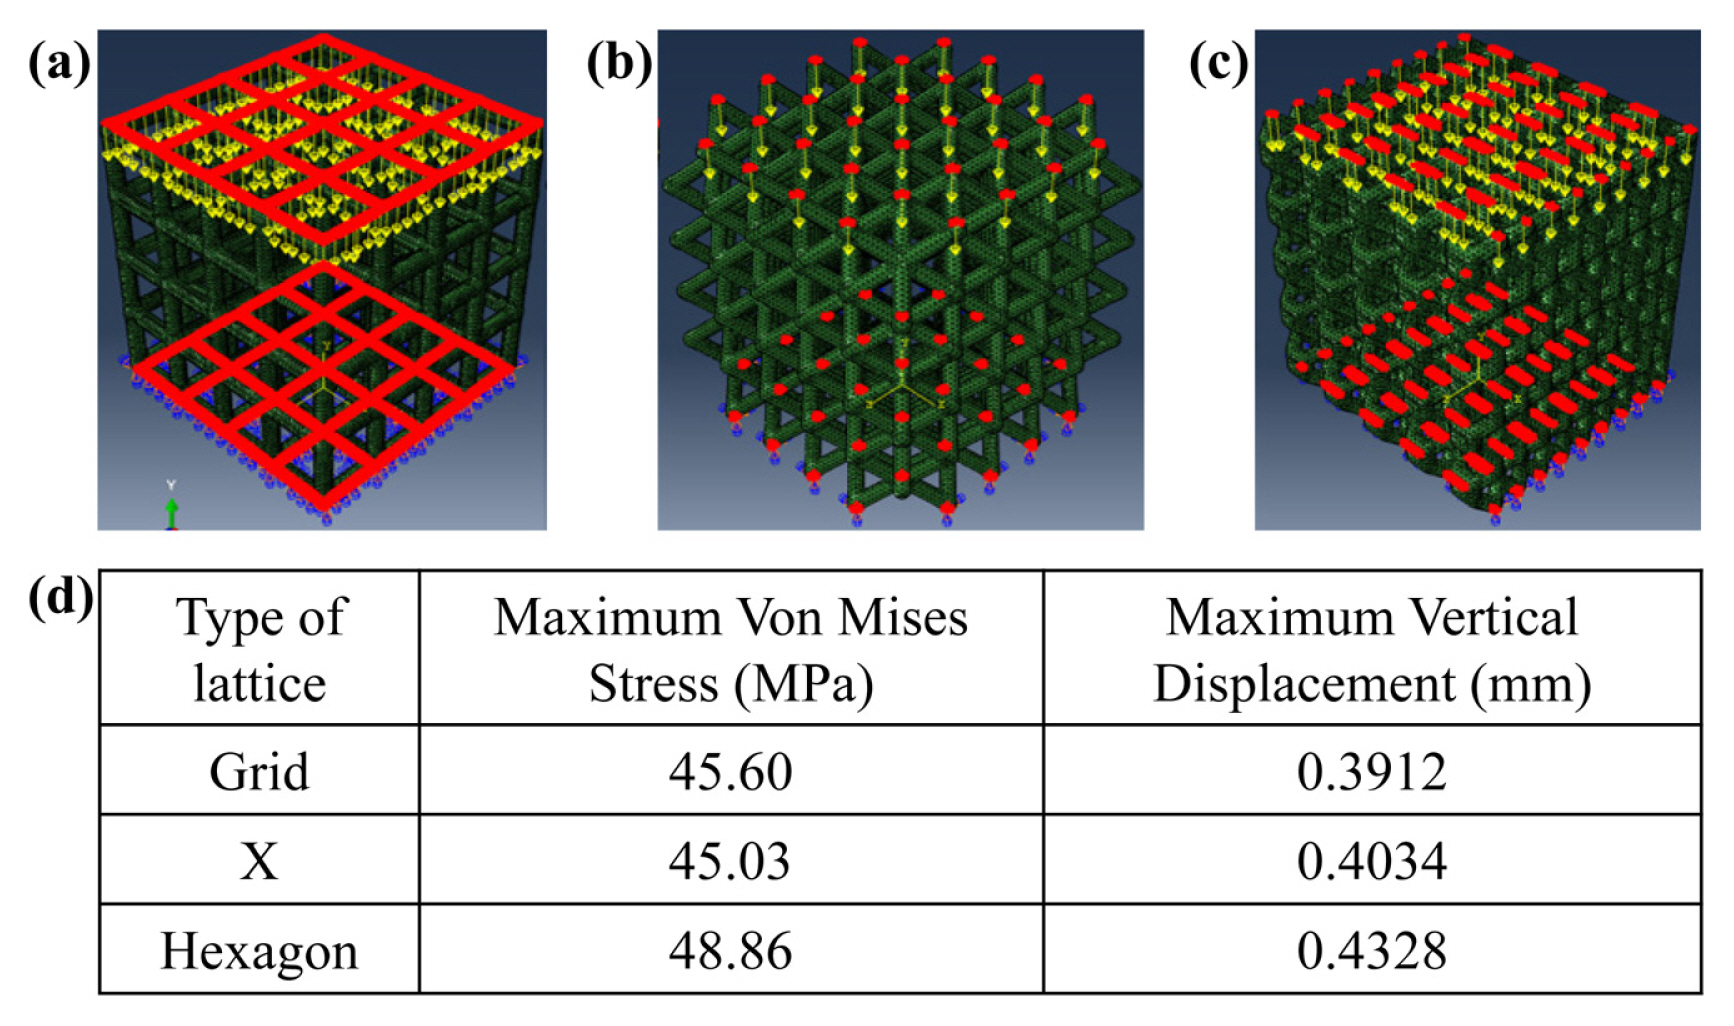
In Step 3, the static compression simulation was used to select a lattice structure. For the simulation, an isotropic elasto-plastic model was used in ABAQUS®. The selected 3 different lattices in Step 2 were investigated through static simulation to observe how they perform under loads. A block of 20 × 20 × 20 mm was modelled and imported into Netfabb, Autodesk. All lattice structures had a unit cell of 4 × 4 × 4 mm and a thickness of 1 mm, like the experimental model. The resulting structure was then imported into ABAQUS to conduct a static compression simulation. The loads were input at the yellow point as shown in Fig. 3(a)-(c). The maximum loads applied to Grid, X, and Hexagon are 0.3 N, 1 N, and 2 N, respectively.
4.3 Exploring Design Space
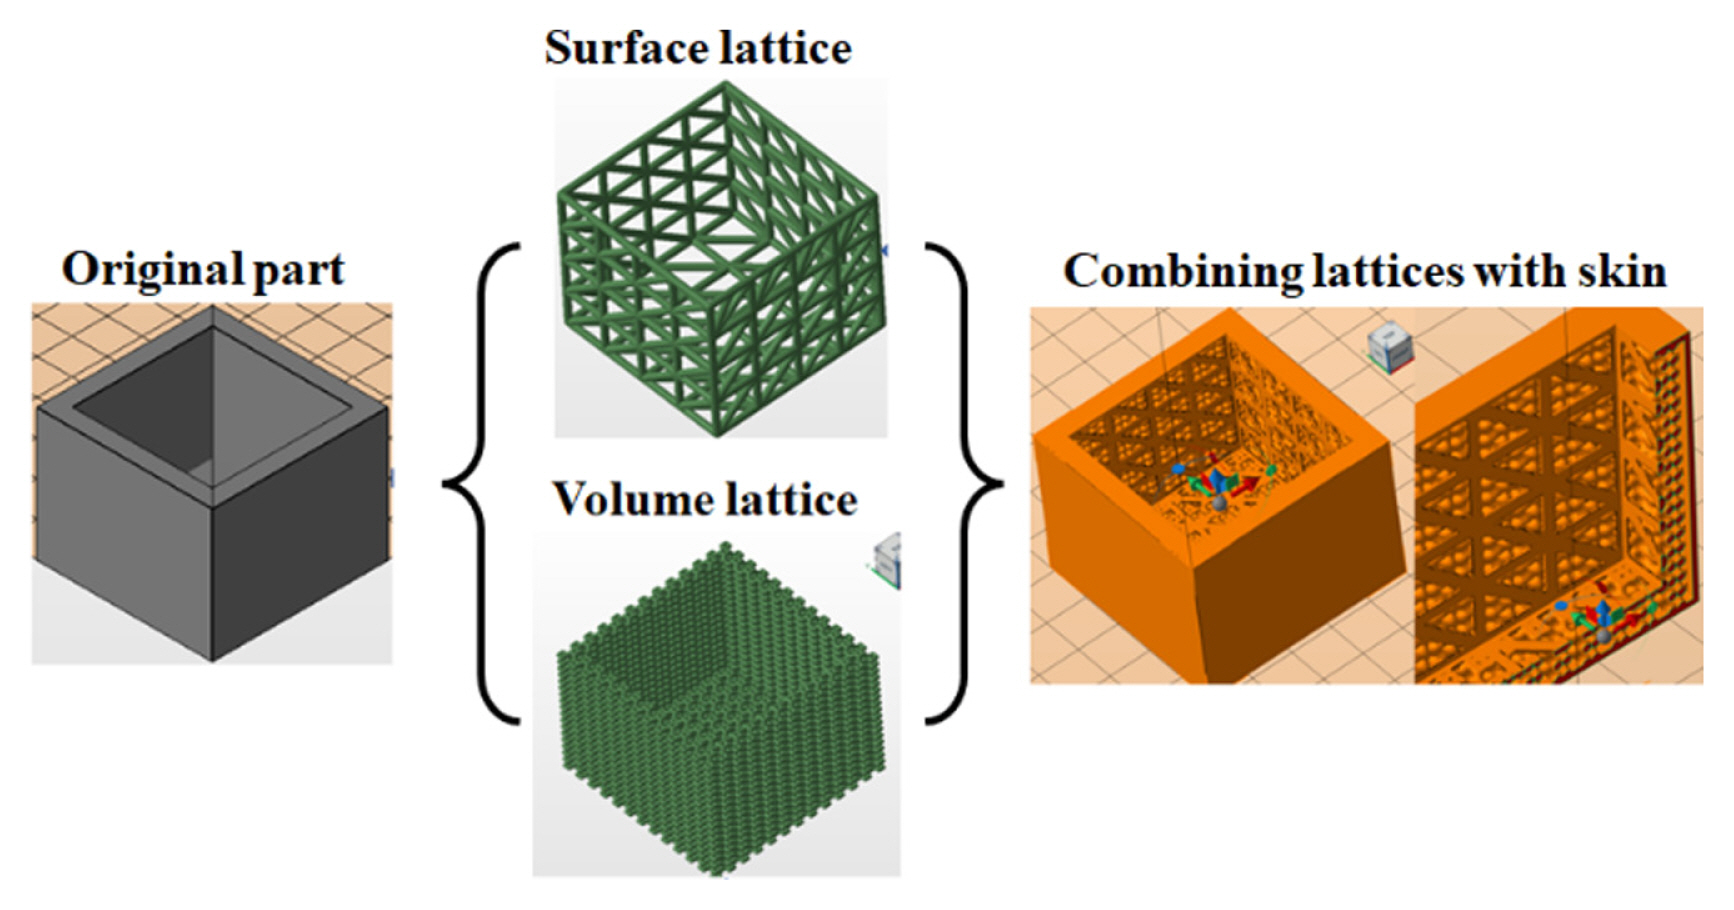
To explore design space in Step 4, the ABAQUS also was used. Fig. 4 shows the workflow of how the lattice structures modelled by Netfabb. The surface lattice and volume lattice can be given respective functionality by changing parameters such as strut’s geometry. In case of the surface lattice, the thickness and length of struts can be controlled in the Netfabb. The volume lattice can be controlled by changing the cell size and topology.
The variable parameters were set as lattice thickness [Sl] of surface lattice, lattice cell size [C] of volume lattice, and skin thickness [Sk] of skin. A skin of a certain thickness was also used to cover the exterior of the component. The design variables can be changed in Netfabb. The total mass and first natural frequency of the original part were 42.6 g and 1014 Hz, respectively.
4.4 Natural Frequency Test of 3D Printed Parts
To obtain the free-free first natural frequency of printed lattice structures, the Dewsoft FRF 6.6 software together with a Fast Fourier Transform analyzer and an impact hammer was used. The part to be tested was hung freely from a height and an accelerometer was attached to it. An impact hammer was used to excite the free-hanging part and the corresponding frequencies were obtained. The average of 5 impacts was used to retrieve the frequency values from the software.
4.5 Results of Simulation for Selecting a Lattice Structure
The objective of this simulation was to identify the lattice with the least deformation under the loads. This was done to narrow down on the lattice type which showed the largest resistance to load as lattice structures not only help to lightweight structures but must also be able to withstand the level of compressive loads during operation.
As mentioned Section of 4.2, when these maximum loads (Grid: 0.3 N, X: 1 N, and Hexagon: 2 N) were applied as boundary conditions, the Grid, X, and Hexagon showed Maximum Von Mises Stress and Maximum Vertical Displacement as shown in Table 1. From the simulation results, it was found that the Hexagon lattice performed the best among all the other lattices. It showed the least vertical deformation as compared to the rest under a uniform force. The Grid lattice performed the worst as it could only carry a load of 0.3 N and the Hexagon lattice performed the best as it was able to carry a load of 2 N. Thus, the Hexagon lattice was selected for the case study.
4.6 Results for Exploration of Design Space through DOE
The surface lattice thickness (Sl), volume lattice cell size (C), and skin thickness (Sk) of Hexagon were applied using Netfabb. The responses to the corresponding combination of design variables are mass (R1) and first natural frequency (R2) as obtained from free-free simulations in ABAQUS. All values in the DOE were obtained from a free-free vibration analysis using ABAQUS. The DOE parameters and results for simulation were shown in Table 2.
A quadratic ANOVA model was used as there was no aliasing unlike that of a cubic model. Sk*Sl, Sk*C and Sl*C represent the interactions as shown in Table 3. Insignificant terms have been removed to improve the overall model. A P-value < 0.0001 implies that the parameter is statistically significant. A high F-value (1145.51 for R1) with a very low P-value (< 0.0001) means that there is only a 0.01% that the high F-value is due to noise. This is also the case for R2.
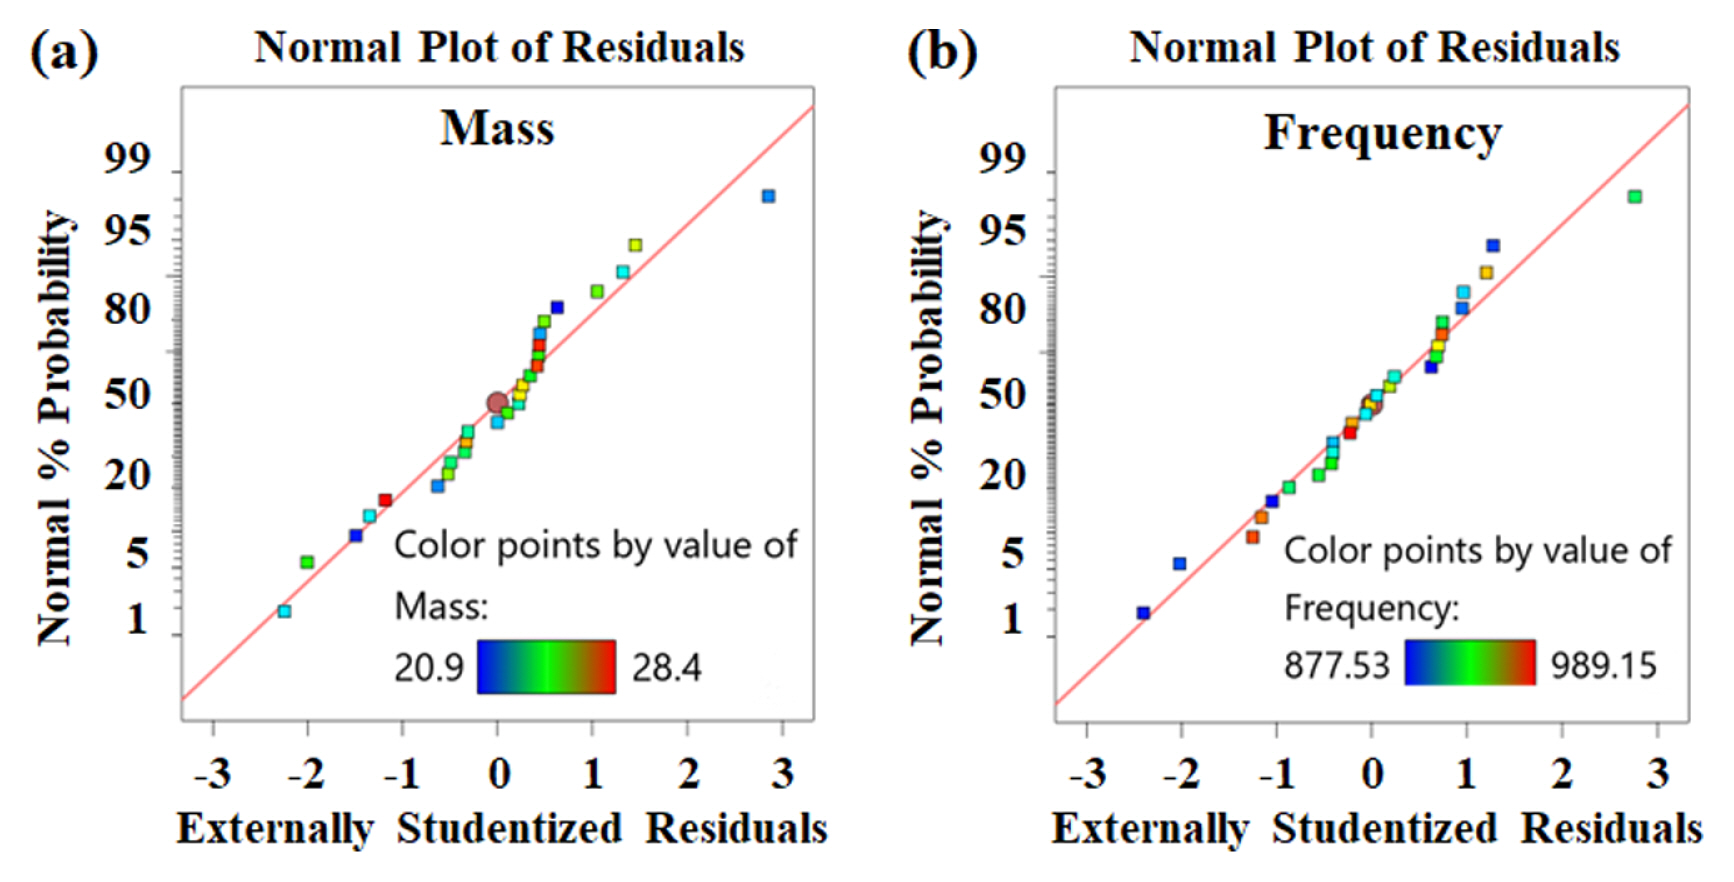
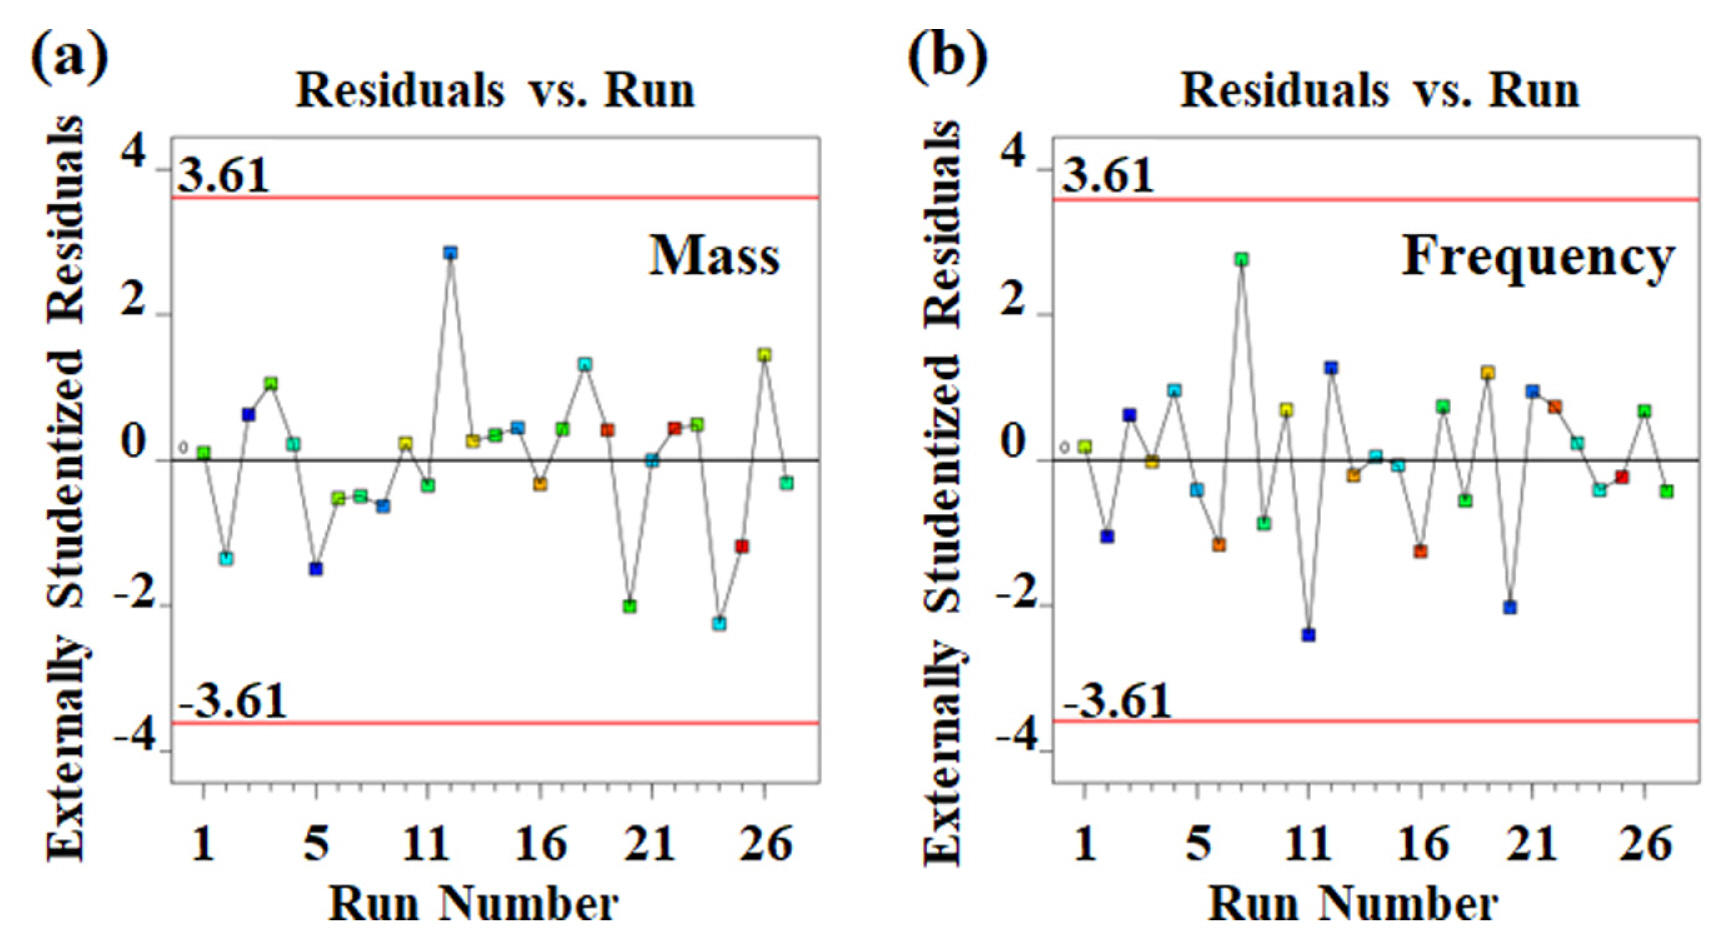
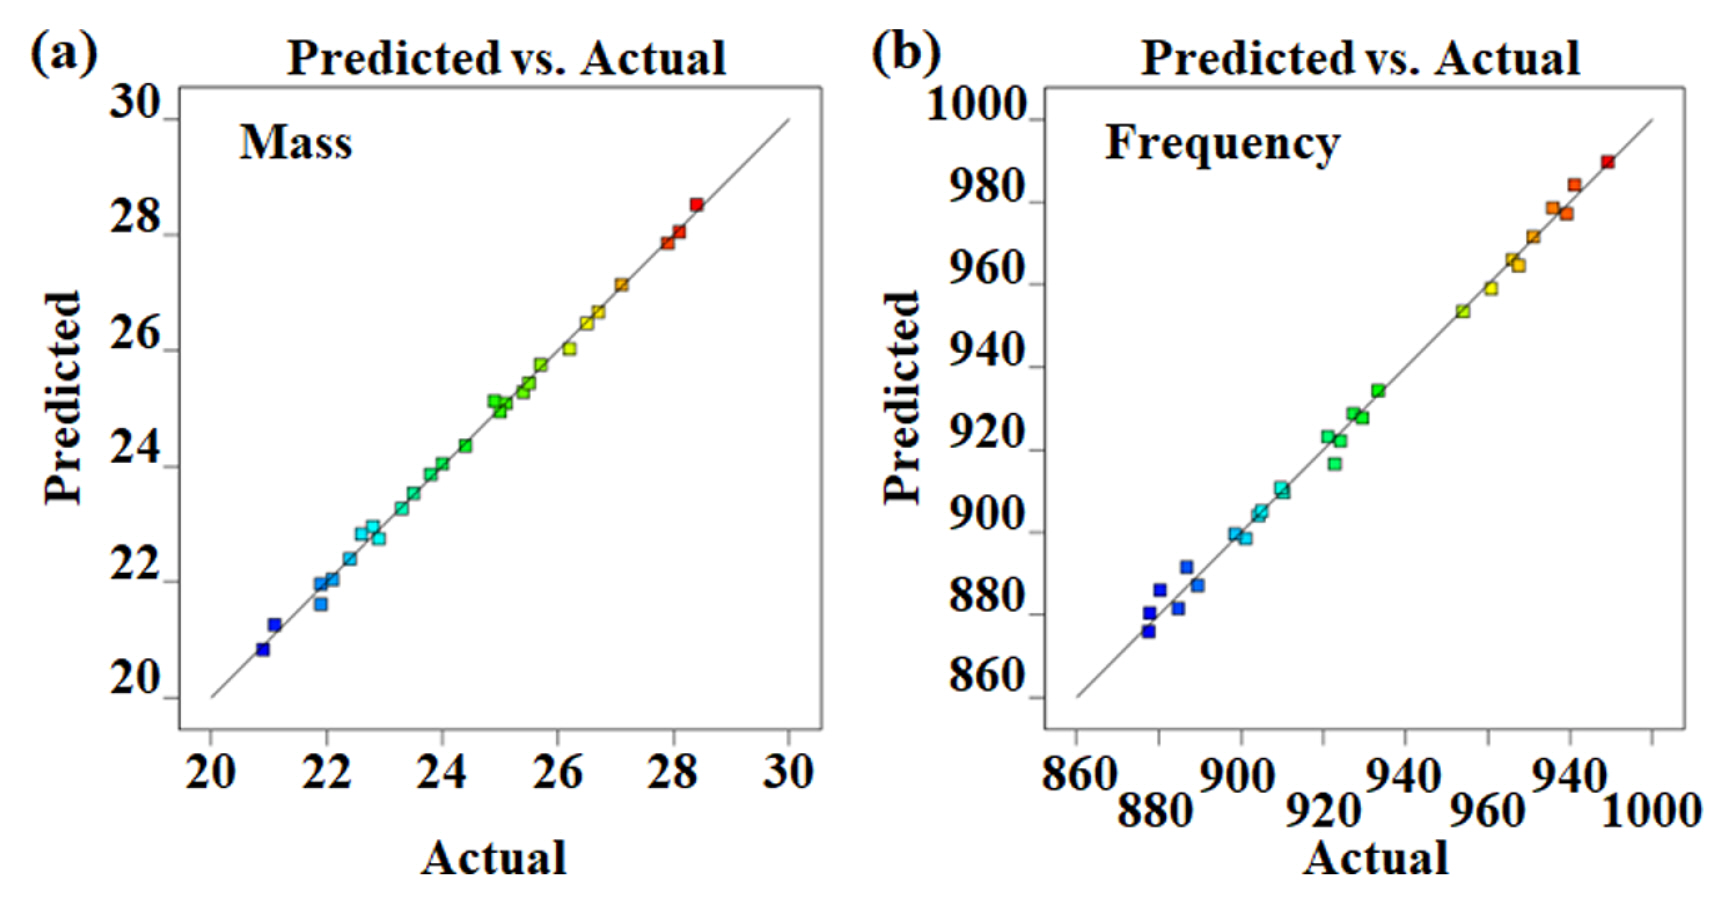
Fig. 5 shows the normal probability plots of the residuals for mass and frequency, respectively. All points in both plots are contained within the range of −3 to 3. This signifies that the testing points are acceptable. The DOE models are accurate even after removing the insignificant terms as the points are scattered along a straight line without much deviation. Fig. 6 shows the residuals versus run order for mass and frequency, respectively. From the plots, no notable clusters were observed, and the points are scattered at random about the centre line. This shows that the residuals are independent, and the model is confirmed to be accurate. Fig. 7 shows the predicted values for the responses (calculated from the DOE model) and the actual responses (from simulation). The function is able to capture the simulation results well with R2 of 0.9947 for mass and 0.9913 for frequency. Thus, ANOVA has confirmed that the obtained models are acceptable. The model for mass and frequency can be expressed as follows:
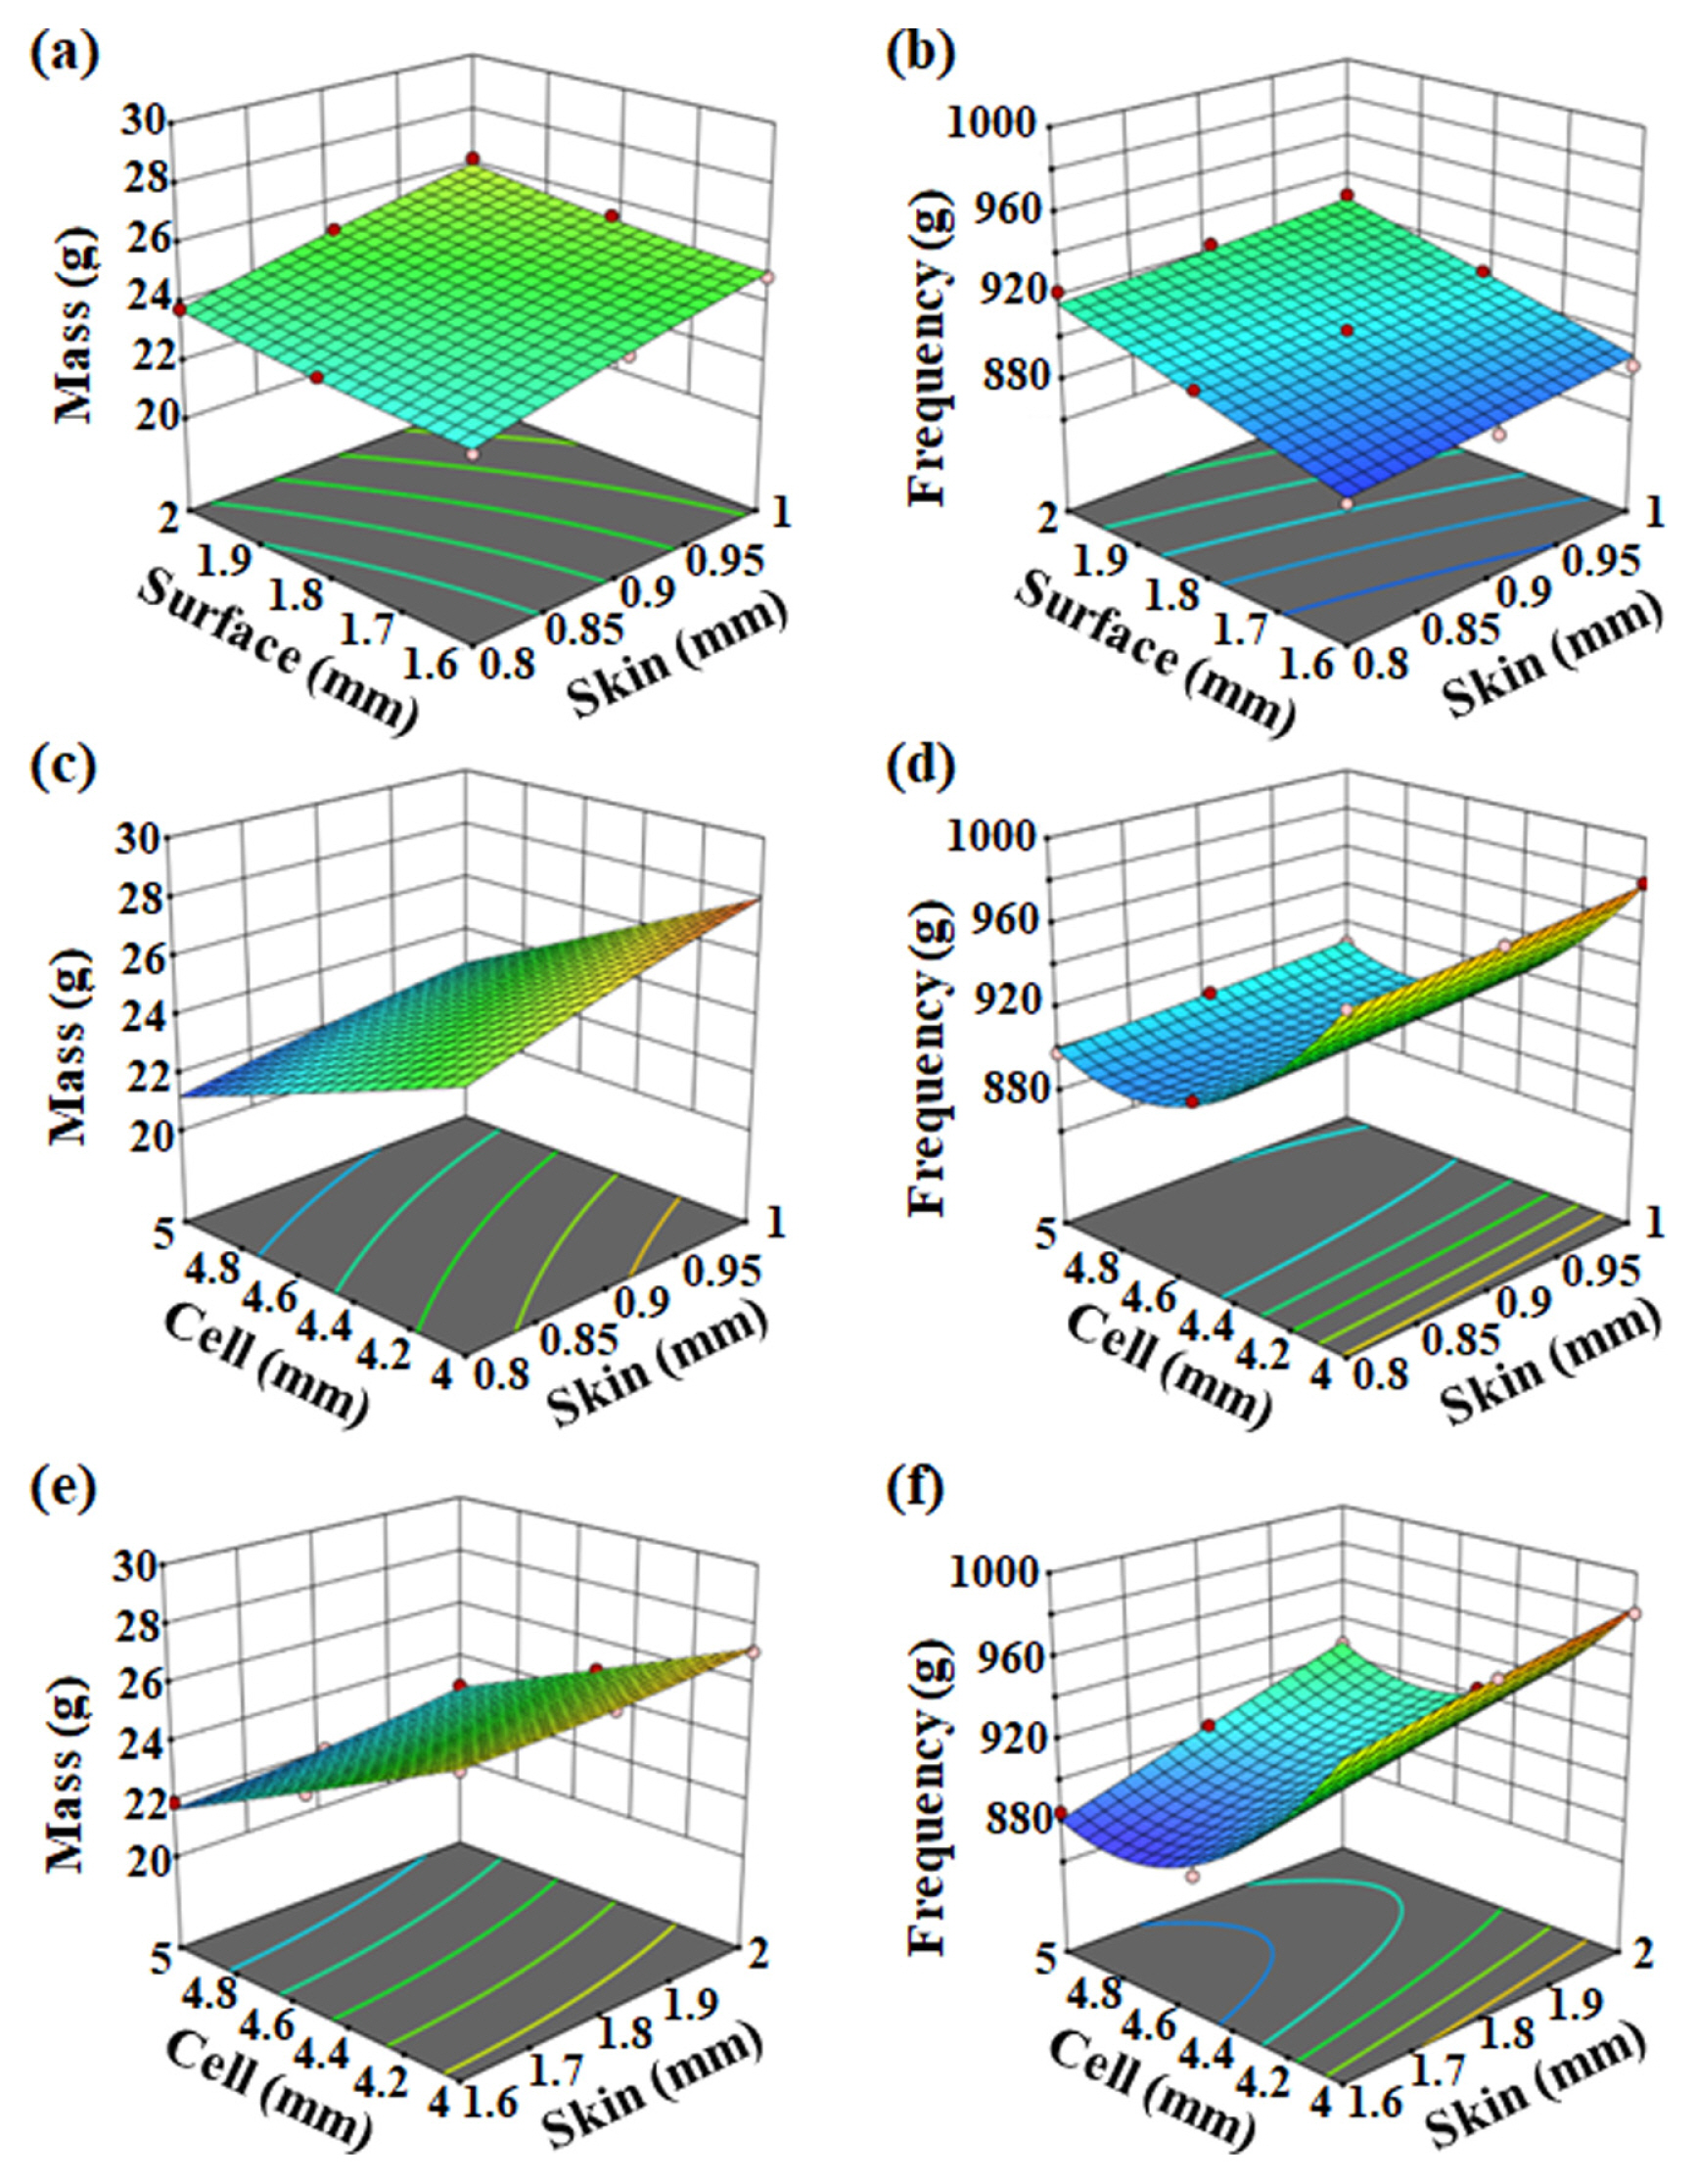
Fig. 8 shows the surface plots of the factors to the inputs. It is to be noted that there are 3 surface plots for each response. Thus with 3 factors, it becomes difficult to identify an optimum region as it is not possible to plot a graph having 4 axes.
Thus, based on the above ANOVA analysis, it was observed that the skin had the least impact on frequency. However, surface lattice thickness has the least impact on mass based on the interactions and surface plots.
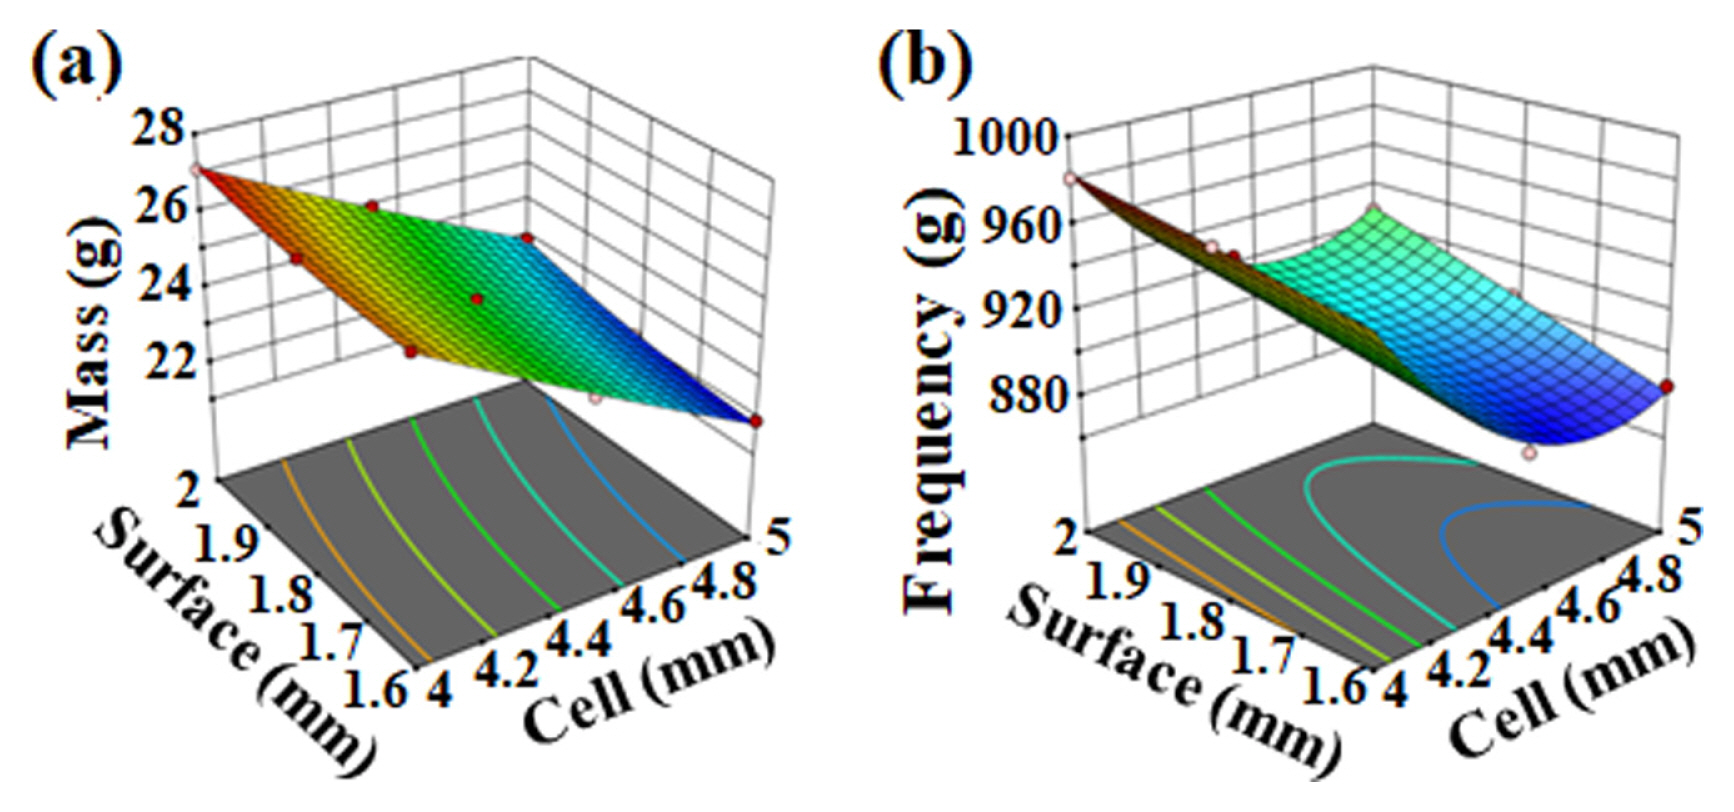
Giving importance to frequency, the factor skin was removed and fixed at 0.9 mm. The corresponding results for the 2 factors DOE and ANOVA results are shown in Tables 4 and 5, respectively.
From the 2-factor analysis, surface plots for mass and frequency were obtained as shown in Figure 9. When the mass is high, the frequency is high, and the reverse is also largely seen to be true from the plots. Thus, mass and frequency are indeed conflicting to the desired objective of maximizing frequency and minimizing mass.
In general, angular frequency is given by the equation ω = √ (k/m), where k and m are the stiffness mass respectively. As mass increases, the frequency decreases, and vice versa. However, from the simulation and the resulting plots, we can see that that is not the case as there is a mixture of results present and the general trend shows that a higher mass has a higher frequency. This suggests that the complex combination of the lattice structures results in a much higher change in the stiffness than in the mass.
4.7 Results for Analysis via Multiobjective Optimization
To optimize the solutions from the DOE results, the fitness functions were obtained for both mass and frequency from the DOE ANOVA analysis and the following formulation as shown in Table 6 is applied for the NSGA-III optimization.
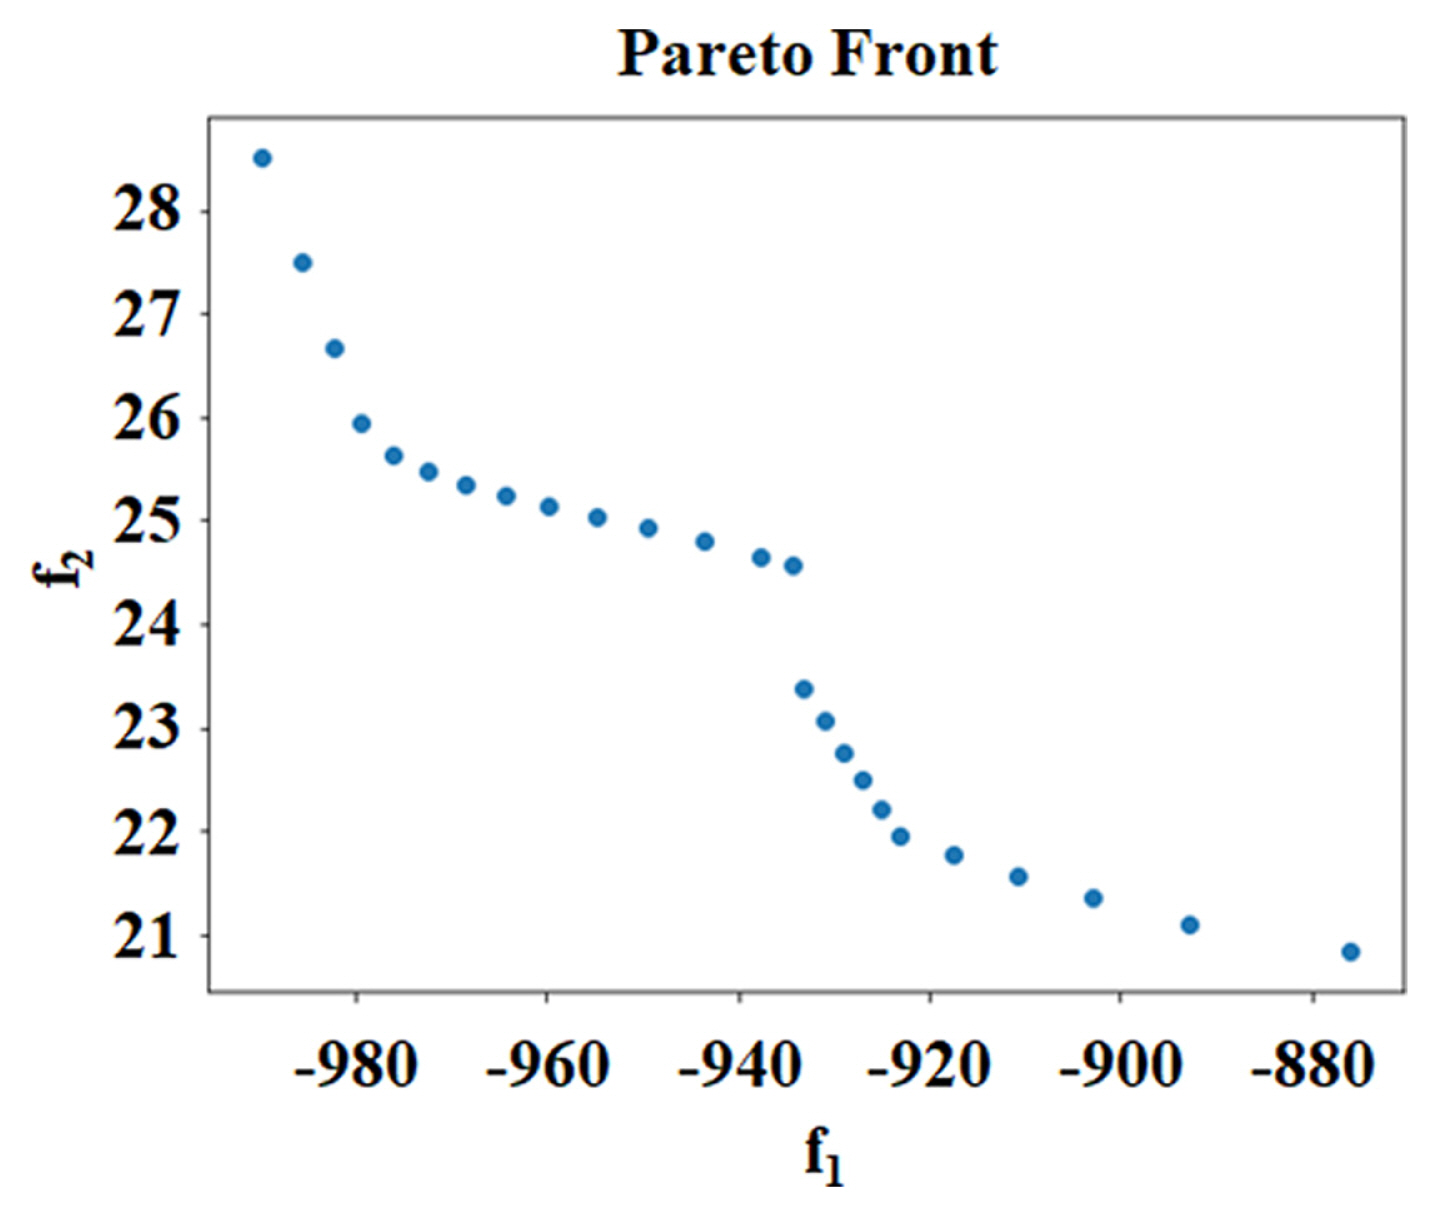
The NSGA-III was initialized with a population size of 500 and the Das-Dennis reference direction with 25 partitions was used. The number of partitions determines the number of points that will be sampled. Each point shown on the Pareto-optimal front is a possible solution that satisfies the requirement of maximizing frequency and minimizing mass. From the graph, it can be seen that a total of 25 different solutions have been identified. A designer can identify a set of Pareto-optimal solutions, and the set can be further extended to include a larger range of values for the parameters or include more parameters of interest.
The Pareto front as obtained from the set of input is shown in Fig. 10. To analyse the run, a metric known as the running metric is used within Pymoo. This metric shows the difference in the objective space from one generation to the next and uses the algorithm’s survival to visualize the improvement.
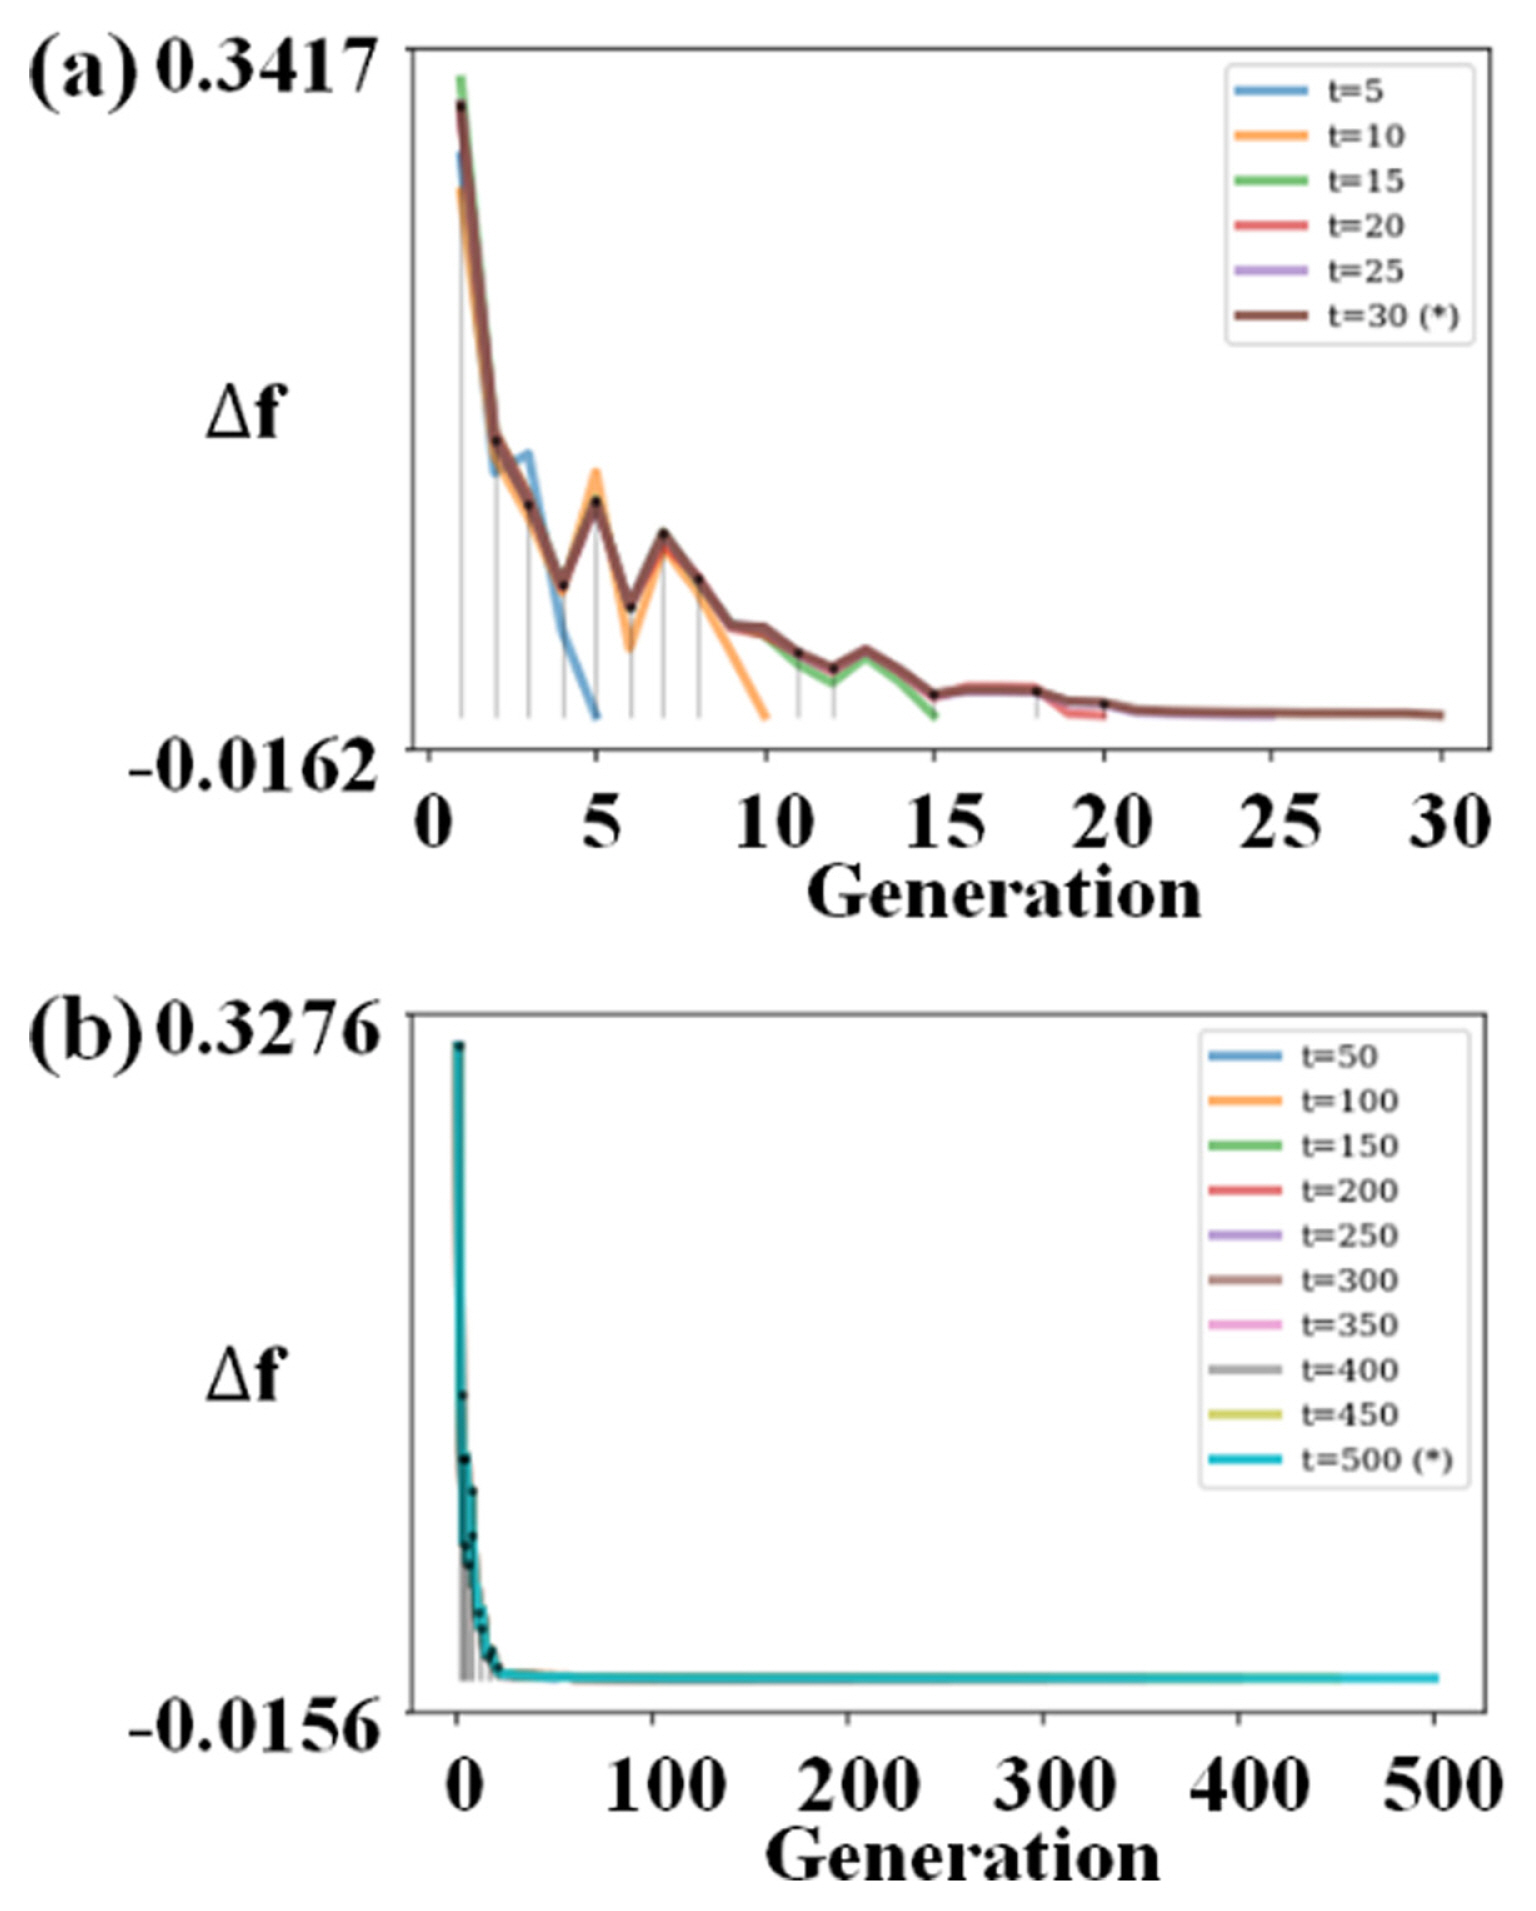
For the analysis performed, the improvement in the algorithm from one generation to the next as shown in Fig. 11(a). Plotting until the final population shows that the algorithm has largely converged as shown in Fig. 11(b). With the Pareto-optimal points identified, the desirability function is then used to rank the 25 solutions from the Pareto front. The points with the higher overall desirability value are deemed to be the better solution. Different sets of masses were explored to observe the selection of the optimal points by using the desirability function. For example, when the mass for frequency is set as 0.3 and the mass for mass is set as 0.7. The top 3 solutions as ranked by desirability function is shown in Table 7. The masses for frequency and mass have quite an effect on the optimal solutions. The assignment for the value of masses can be determined by the designer according to his needs and a suitable optimal solution can be used.
5 Discussion
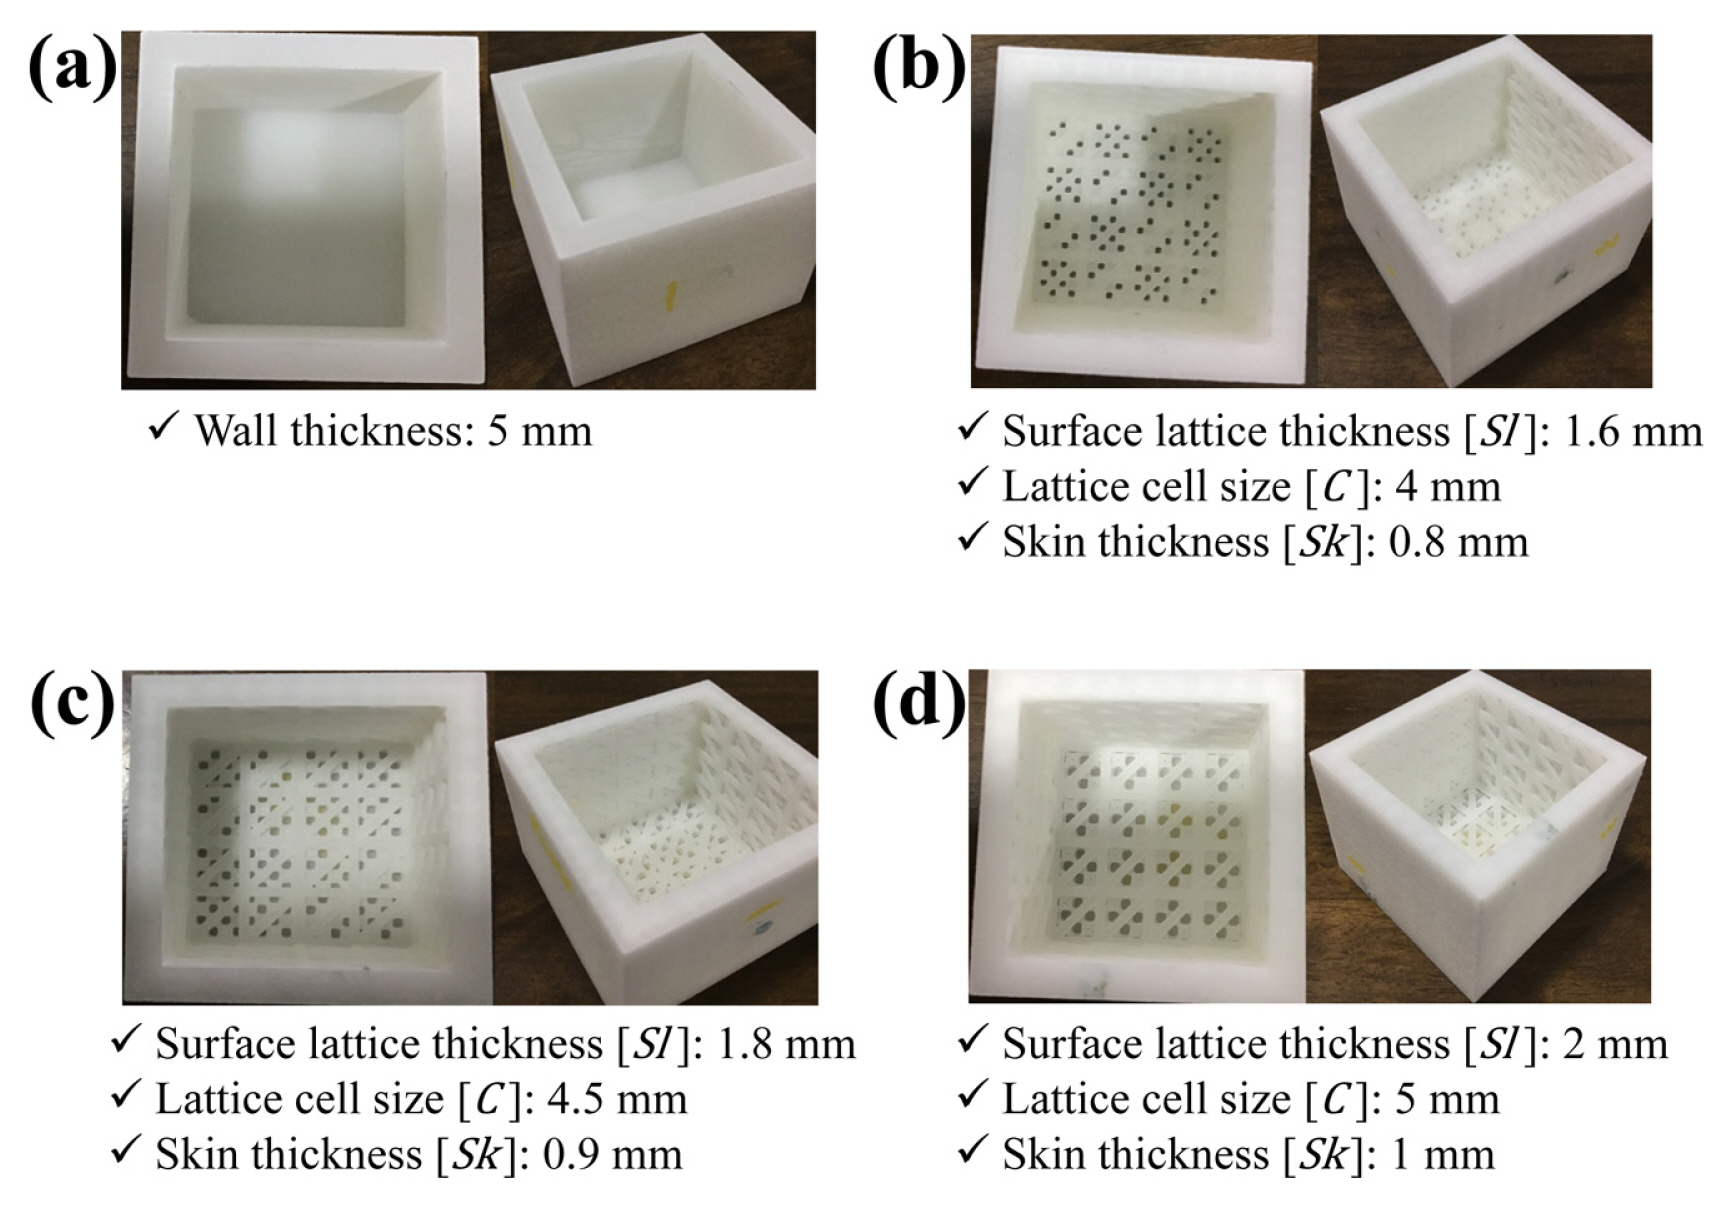
8 Parts (2 of each from DOE table 2-Solid, Run 1, Run 14 and Run 27) were printed for the purpose of experimental comparison with the simulation results for frequency and mass with respect to the DOE table 2 as shown in Fig. 12.
With 2 parts and 3 replications for each of the printed samples, a total of 6 experimental readings were obtained for each sample. The average of all 3 repetitions was taken as the finalized first natural frequency of the printed parts as shown in Table 8.
The percentage difference between the simulation and experimental results from Print 1 and Print 2 are shown in Tables 9 and 10. The solid prints had the least difference between the simulation and experiments. For both Prints 1 and 2 the largest difference in mass occurs in Run 1 at 11.9% and 7.7% respectively. The percentage difference in first natural frequency increases from Run 1 to Run 27 for both sets of prints.
It can be seen from the results that the mass and frequency of parts from Print 2 were lower than that of Print 1 and the difference is highlighted in Table 11. Although these numbers may seem small, it is to be noted that Run 27 of print 2 had a huge difference from the simulation at 17%. From this variation between the 2 sets of prints, it is necessary to conduct a process parameters optimization study to ensure the repeatability of the printed parts so that parts with consistent properties can be printed.
Run 1 has the highest first natural frequency obtained among the printed parts. Comparing this to the solid part, Run 1 has a mass saving of nearly 35% with a frequency drop of about 20%.
Although difference rates between simulation and 3D printed parts in terms of mass and frequency are rough as 3.1% to 17.7%, there is no error to find the solutions using the proposed framework in this study. The properties of material input to the simulation did not reflect the anisotropic characteristic of the 3D printed parts. In this study, the parts fabricated by SLS have an anisotropic property according to deposition direction [32]. Thus, the difference rate of the mass and frequency between the simulation and the printed parts will be minimized, if the simulation is performed with the anisotropic properties of the 3D printed parts, Because the difference rates between Prints 1 and 2 regarding for mass and frequency have relatively low value of below 6.2%. The difference gap between simulation with anisotropic property of 3D printed parts and Print is a research topic to be supplemented in the future.
6 Closing Remarks and Future Work
In this research, a design framework was proposed to determine lattice structures for satisfying the functional requirements of a 3D printed part using DOE and multi-objective optimization. The proposed framework was consisted of 6 steps. In Steps 1 and 2, a component was chosen, and the functional requirements were identified. In Step 3, the final lattice structure to be investigated was selected from a static compression simulation. The selected lattice structure and surface lattice were applied to the chosen component. In Step 4, DOE was performed to investigate the influence of responses due to multiple inputs and in Step 5, a multiobjective optimization was performed to obtain the goal. Finally, parts were printed to validate the framework.
In the case study, a shelled cubic model was focused on maximizing first natural frequency and minimizing mass. PA 11 and the SLS printing methods were used for experimental validation. The Hexagon lattice was explored more extensively by applying it to the case study part. A total of 25 possible optimum design points were identified by NSGA III. The points were ranked by assigning masses using the desirability function. Finally, the selected parts were printed based on DOE to compare the simulation results experimentally. The natural frequency of the final structure increased with increasing mass.
Future work will include the validation of the demonstrated multiobjective optimization parameters. Although only SLS is used in this research, the proposed framework can be applied to other AM methods and materials. The work presented here can be further extended to include more lattice structures and their lattice definition inputs. This can be combined with different responses such as impact energy and compressive loads. Since only linear simulation was performed in this work, a more in-depth simulation can be performed which accounts for the failure of the structure and crack propagation. This would provide more insight as to how different lattice structures behave under different loads and what are their failure modes. Furthermore, the anisotropic properties of 3D printed parts should be reflected as boundary conditions in the simulation. These lead the more similar results between simulation and 3D printed parts in terms of frequency.


 PDF Links
 PubReader
 Full text via DOI
 Download Citation
  CrossRef TDM


