 E-mail
 Print
Print facebook
 twitter
 Linkedin
 google+
1 Introduction
The directed energy deposition (DED) process is a representative metal additive manufacturing technique. This process involves the use of a high-energy heat source, such as a laser, to irradiate a substrate, creating a molten pool. Simultaneously, it supplies metal powder or wire to construct a three-dimensional structure. This method’s advantages extend beyond repairing parts due to the deposition head’s freedom in multiple axes. It’s also ideal for producing high-strength functional components from similar or different materials. Its versatility has resulted in widespread applications across high-value industries like aerospace, space exploration, automotive, and marine. It enables localized repairs of damaged sections without the need for complete part replacement, reducing costs and minimizing downtime [1–3].
In the context of repair applications, this process necessitates functionalities beyond defect management, requiring precise area filling in damaged sections. Selecting appropriate process parameters to achieve the target volume is crucial for productivity, health, and efficiency. This emphasizes the critical importance of precise geometric control, particularly concerning three-dimensional structure fabrication. Among various geometry factors, controlling height stands out as pivotal. Height directly influences geometry in layer-by-layer additive manufacturing processes. And uncontrolled height not only influences the external quality but also significantly affects the internal. For example, inappropriate z-offset due to irregularities can lead to defects like lack of fusion, altering heat or material supply [4,5]. Thus, height control is imperative to ensure both internal and external quality, securing process reliability. This is why this research prioritizes controlling height as a quality parameter.
In fact, there are numerous studies that have analyzed the correlation between height and quality, depending on process parameters. Bax et al. [6] analyzed the relationship between geometry indicator results such as height and width depending on process parameters like powder supply and scanning speed in laser cladding. In addition, Feenstra et al. [7] investigated the impact of build height on the mechanical and corrosion properties of SS316L manufactured by DED and examined the relationship between these factors. However, there is another issue here. Even when using the same process parameters, there are variations and inconsistencies in geometric factors such as width and height. This dependency isn’t solely on input parameter values but relies on values actually produced, influenced by environmental factors like humidity, temperature, etc. [8–11]. For instance, higher laser output or powder mass flow leads to increased energy and material supply, resulting in larger formations [12–14]. Therefore, current research on geometry prediction is based on in-process data obtained from various sources, such as images, temperature sensors, etc., rather than relying solely on input parameter values. Takushima et al. [15] and Hsu et al. [16] predicted the height of single-layer single-track deposits utilizing melt-pool images captured through vision systems. Additionally, Kim et al. [17] developed an artificial neural network (ANN) model to predict the height of the target layer in a multi-layer, multi-track toolpath using infrared thermal images, cooling rates, and others. However, these approaches are limited as they only consider a singular representative height for each layer or track. As previously mentioned, despite the same input parameters, different results occur due to other environmental factors. Essentially, different heights are observed within the same layer or track. Consequently, a specific height value cannot represent all heights for a large area, and there is a limit to the ability of subsequent layers to compensate for height errors in previous layers. Therefore, complete geometric control requires profile-level quality prediction of the observation area.
Therefore, in this study, a 1D-CNN model is developed to predict the height profile of each track using melt-pool images collected by a CCD camera during the process. Initially, DED experiments are conducted under various process conditions, and melt-pool images during the process and the height of deposited material are captured using a line scanner. Image pre-processing is used to extract regions of interest (ROI) from each sensor’s features obtained from melt-pool images, and track-specific deposition height profiles are obtained from the line scanner. Data reorganization is performed to synchronize the time information of the collected melt-pool images and height data, and data size is standardized using interpolation to resolve data size inconsistencies due to data collection variations due to process parameters and processing time. Finally, a 1D-CNN algorithm is developed using the processed data to predict the height profiles in the DED process.
2 DED Testbed and Sensor Module
2.1 DED Experimental Testbed
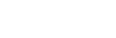
The experimental setup employed for data collection in the DED process was composed of the following main components: a fiber laser, chiller, metal powder supply, dust collector, and a 4-axis CNC machine equipped with a deposition laser head, as shown in Fig. 1. The continuous wave single mode fiber laser (RFL-C1000, Wuhan Raycus Fiber Laser Technologies) had a maximum power output of 1,000W, a wavelength of 1080 nm, and a laser diameter of 3 mm, and acts as a primary heat source. The laser was attached to the deposition head and positioned in the Z-axis direction of the CNC equipment (DH-400-2Z, Harim Machinery). It emitted heat onto the metal substrate. The metal powder was supplied via the powder feeder (GTV-Powder Feeder RF, GTV) and guided towards the melt pool using a delivery gas. In addition, an inert shielding gas was used to prevent oxidation throughout the deposition process. The gas used for both delivery and shielding purposes was argon. The metal powder, delivery gas, and shielding gas were provided in a coaxial manner to the melt-pool through the deposition head.
2.2 Sensor Module for Data Acquisition
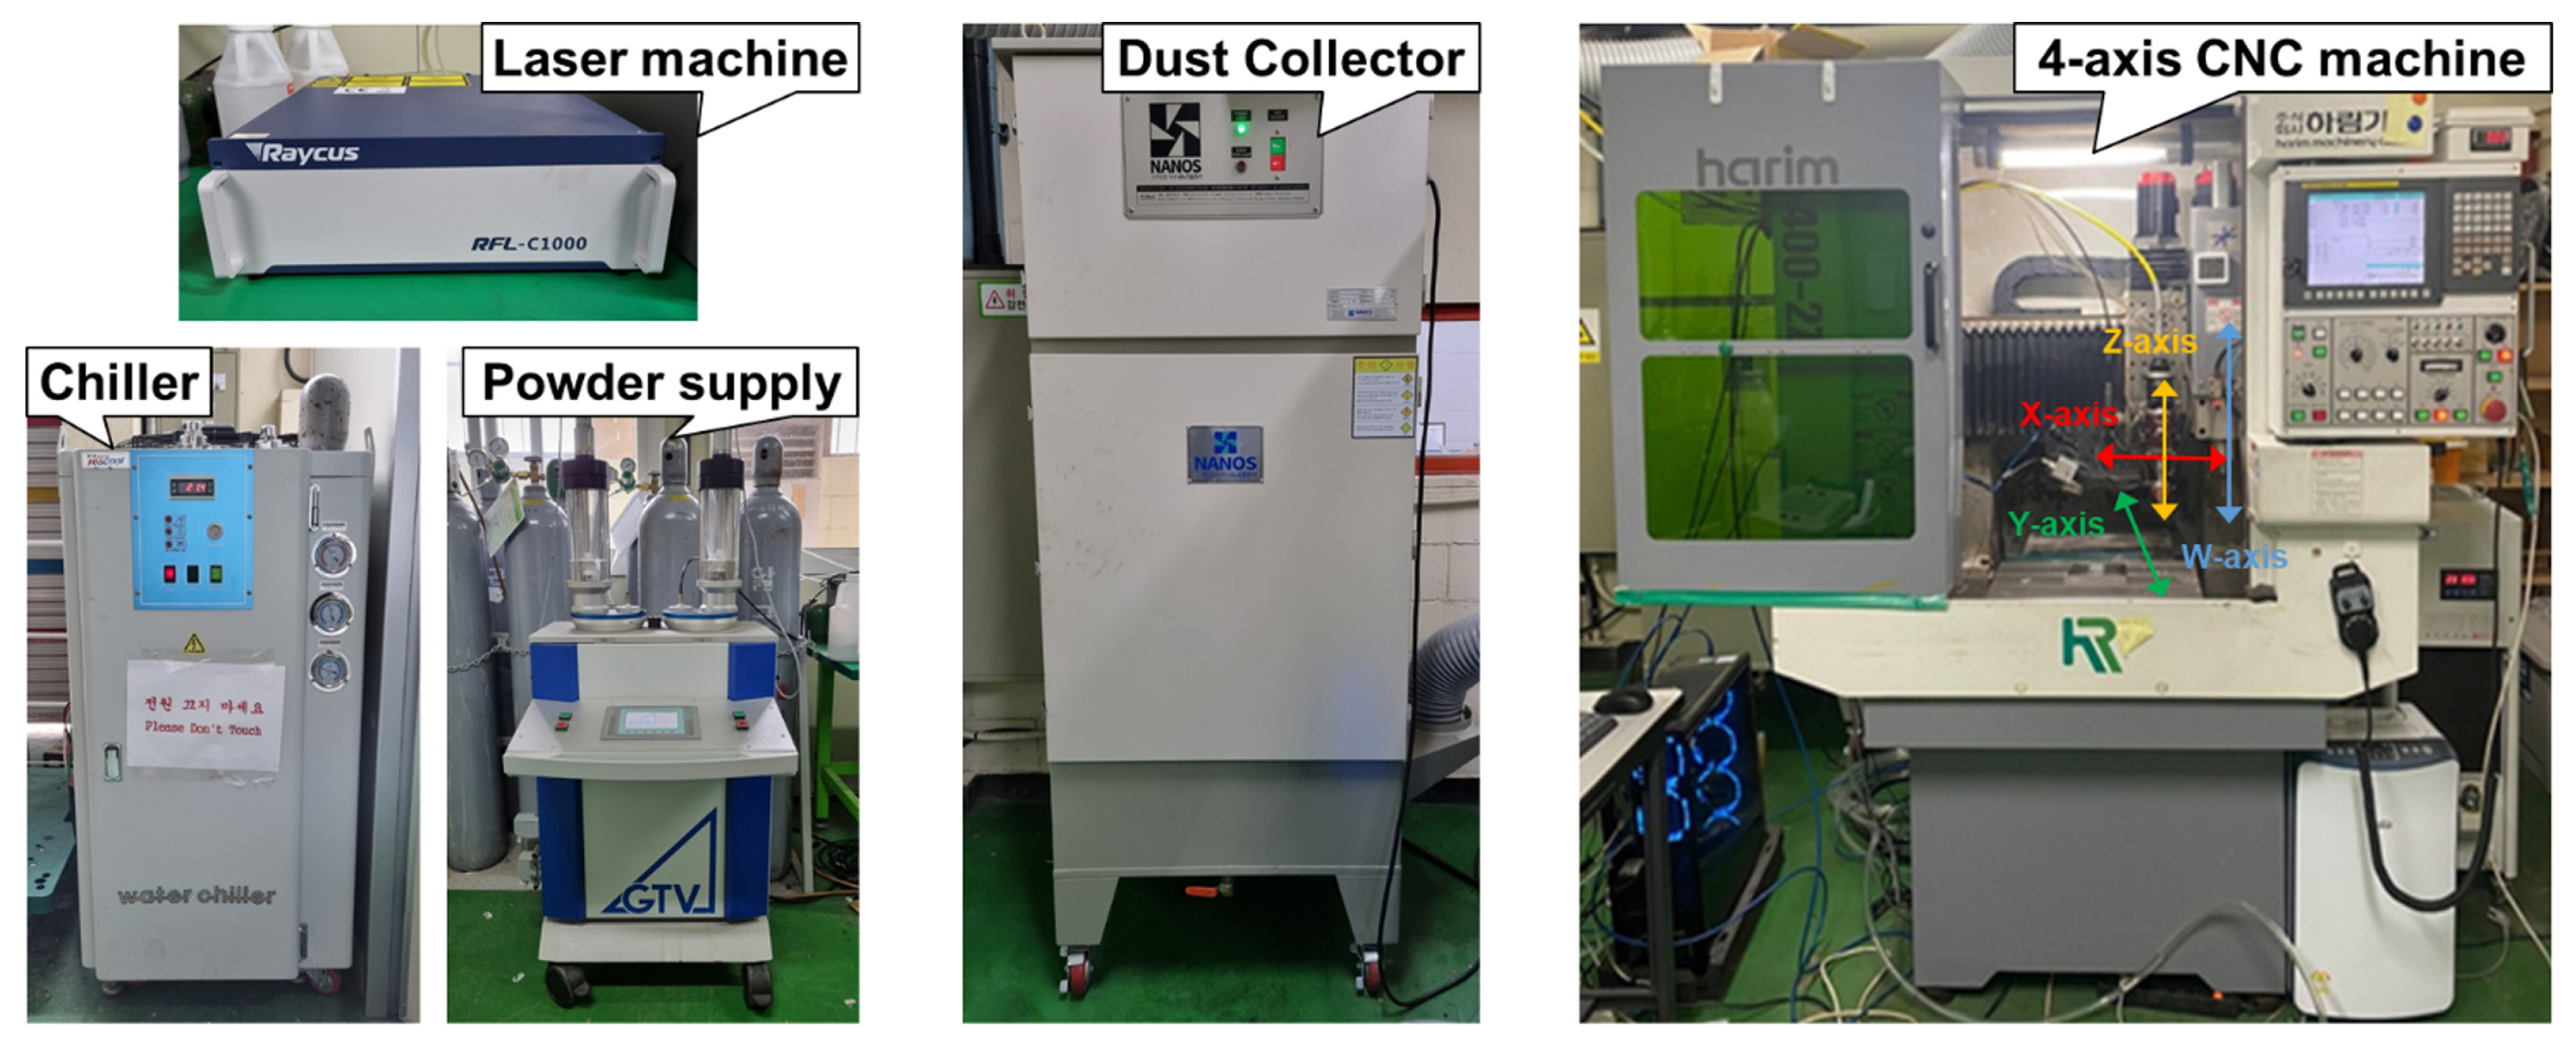
In Fig. 2, sensors were selected and installed to capture melt-pool images and measure the geometry of the deposited area. Initially, a non-contact sensor, the CCD camera (CM3- U3-13Y3M, FLIR), was installed for capturing melt-pool images. Positioned at a 31-degree angle and 290 mm distance from the melt-pool, this sensor was equipped with a near-infrared bandpass filter (BN 850, MidOpt) operating in the 840–865 nm wavelength range. Designed specifically for capturing the melt-pool while filtering laser reflections and visible light wavelengths, this filter ensured minimal noise. Python was utilized for gathering the melt-pool images, collecting data at an approximate speed of 10Hz due to data storage processing time. Additionally, a line scanner (LJ-X8080, Keyence) was selected and installed to measure the geometry of the deposited area. From the data collected through this sensor, a data pre-processing process was performed to extract the stack height profiles.
2.3 Sensor Data Pre-processing
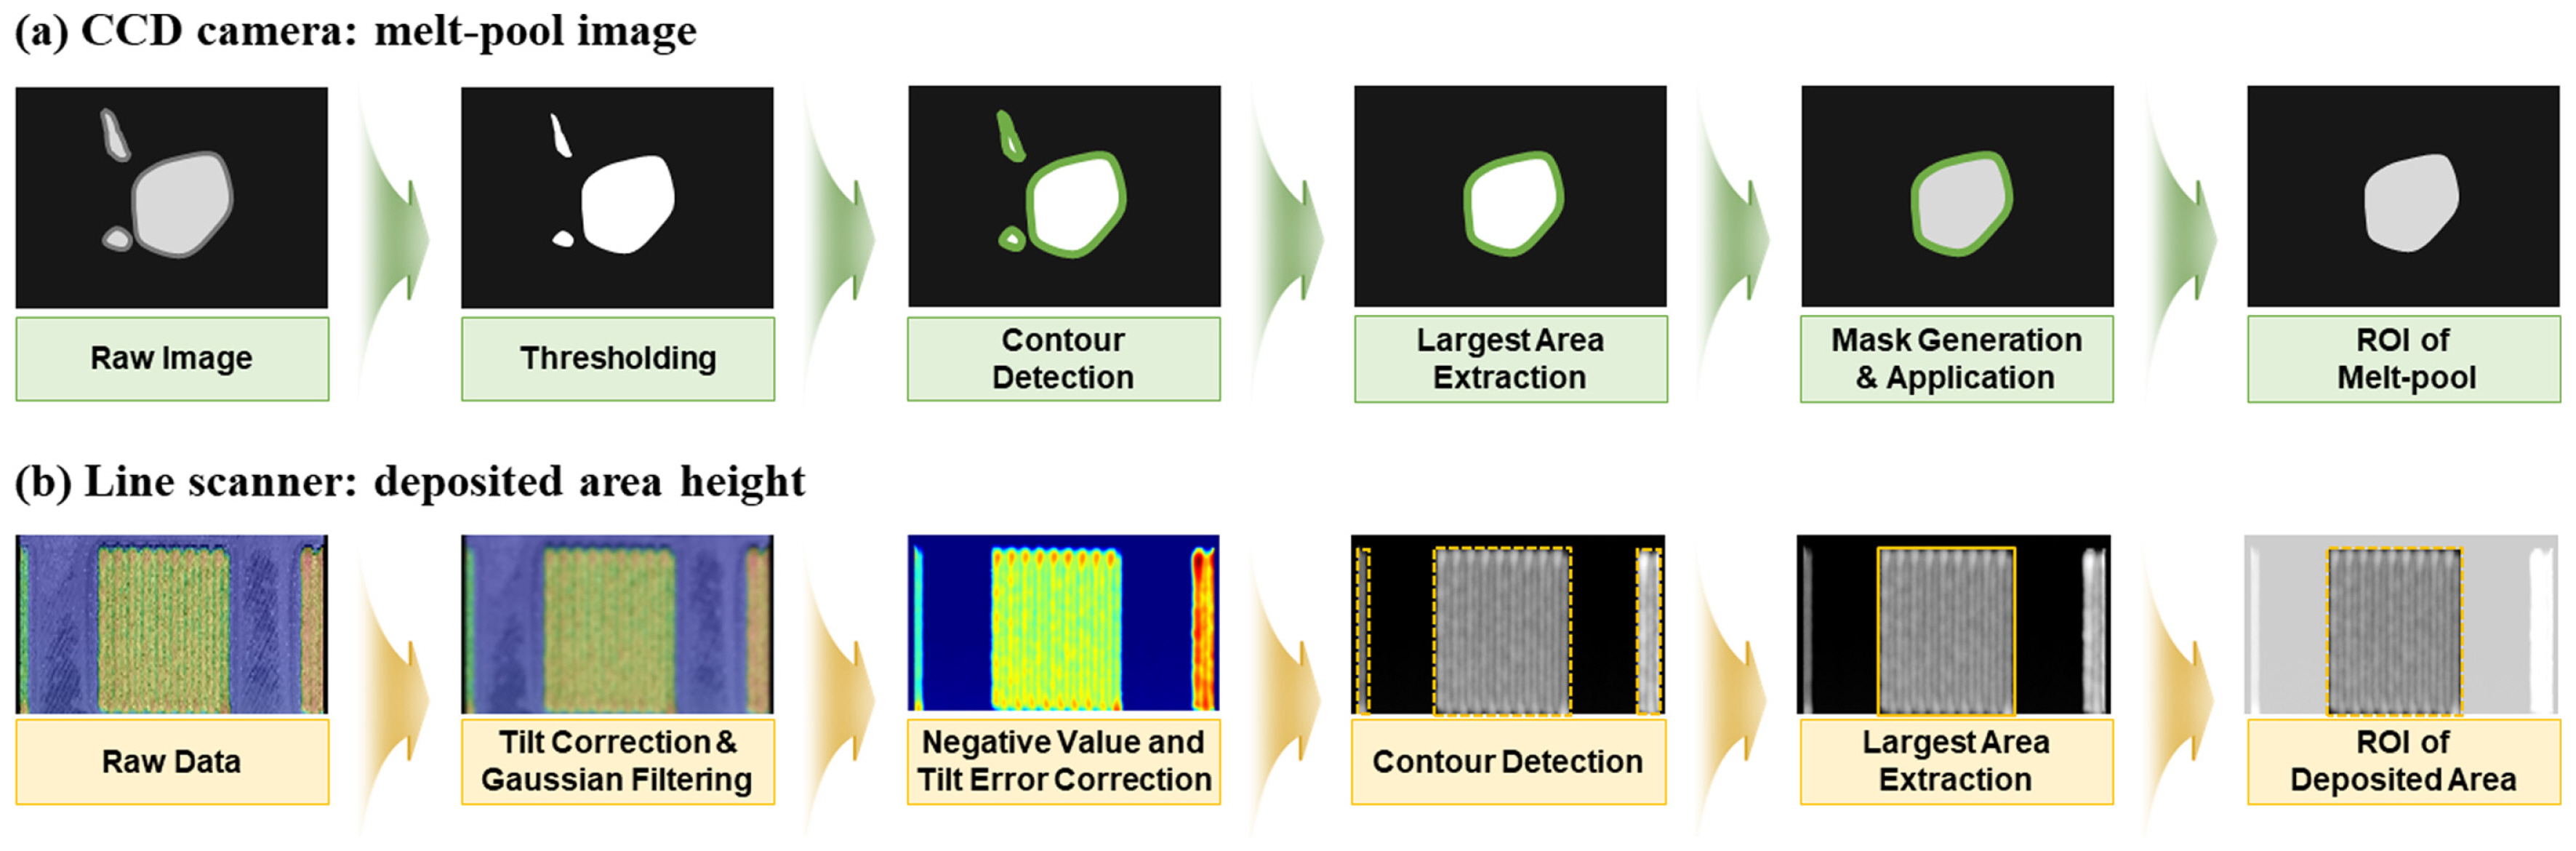
The OpenCV library was utilized for data preprocessing, as shown in Fig. 3, to identify regions of interest (ROI) from the data obtained by the CCD camera and line scanner. Initially, in the case of the CCD camera, despite the installation of the near-infrared band-pass filter, additional noise was captured due to the recoil pressure of the melt-pool and oxidation-induced explosions. In order to resolve this issue, a thresholding algorithm with a value of 165 was used to mitigate the effect of the noise. Afterward, the contours of the melt pool within the captured region were identified, and the largest contour was selected as the final melt pool contour. A mask was created using this contour, replacing the original data and isolating the ROI that corresponds to the melt-pool.
In addition, the data obtained from the line scanner contained information not only from the intended deposition areas but also from the entire scanned region, including sharp details of the deposited surface owing to its high resolution. Therefore, pre-processing was crucial for identifying the target deposition areas and smoothing the sharp surface details to accurately extract the desired deposition height. For this process, tilting compensation was applied using the manufacturer-provided software to eliminate noise associated with camera physical settings. Subsequently, the raw height data was saved as a CSV file and processed using the OpenCV library as well. By applying a 25 × 25 Gaussian filter twice, the visibility of height differences between deposition tracks was improved. Moreover, to maintain only substrate plane-related information (set as the zero point) and discard data from areas below this plane (with negative values), these regions were replaced with 0. Finally, the largest contour representing the target area was extracted, thereby isolating the ROI within the deposition area.
3 DED Experiments
3.1 DED Experimental Setup
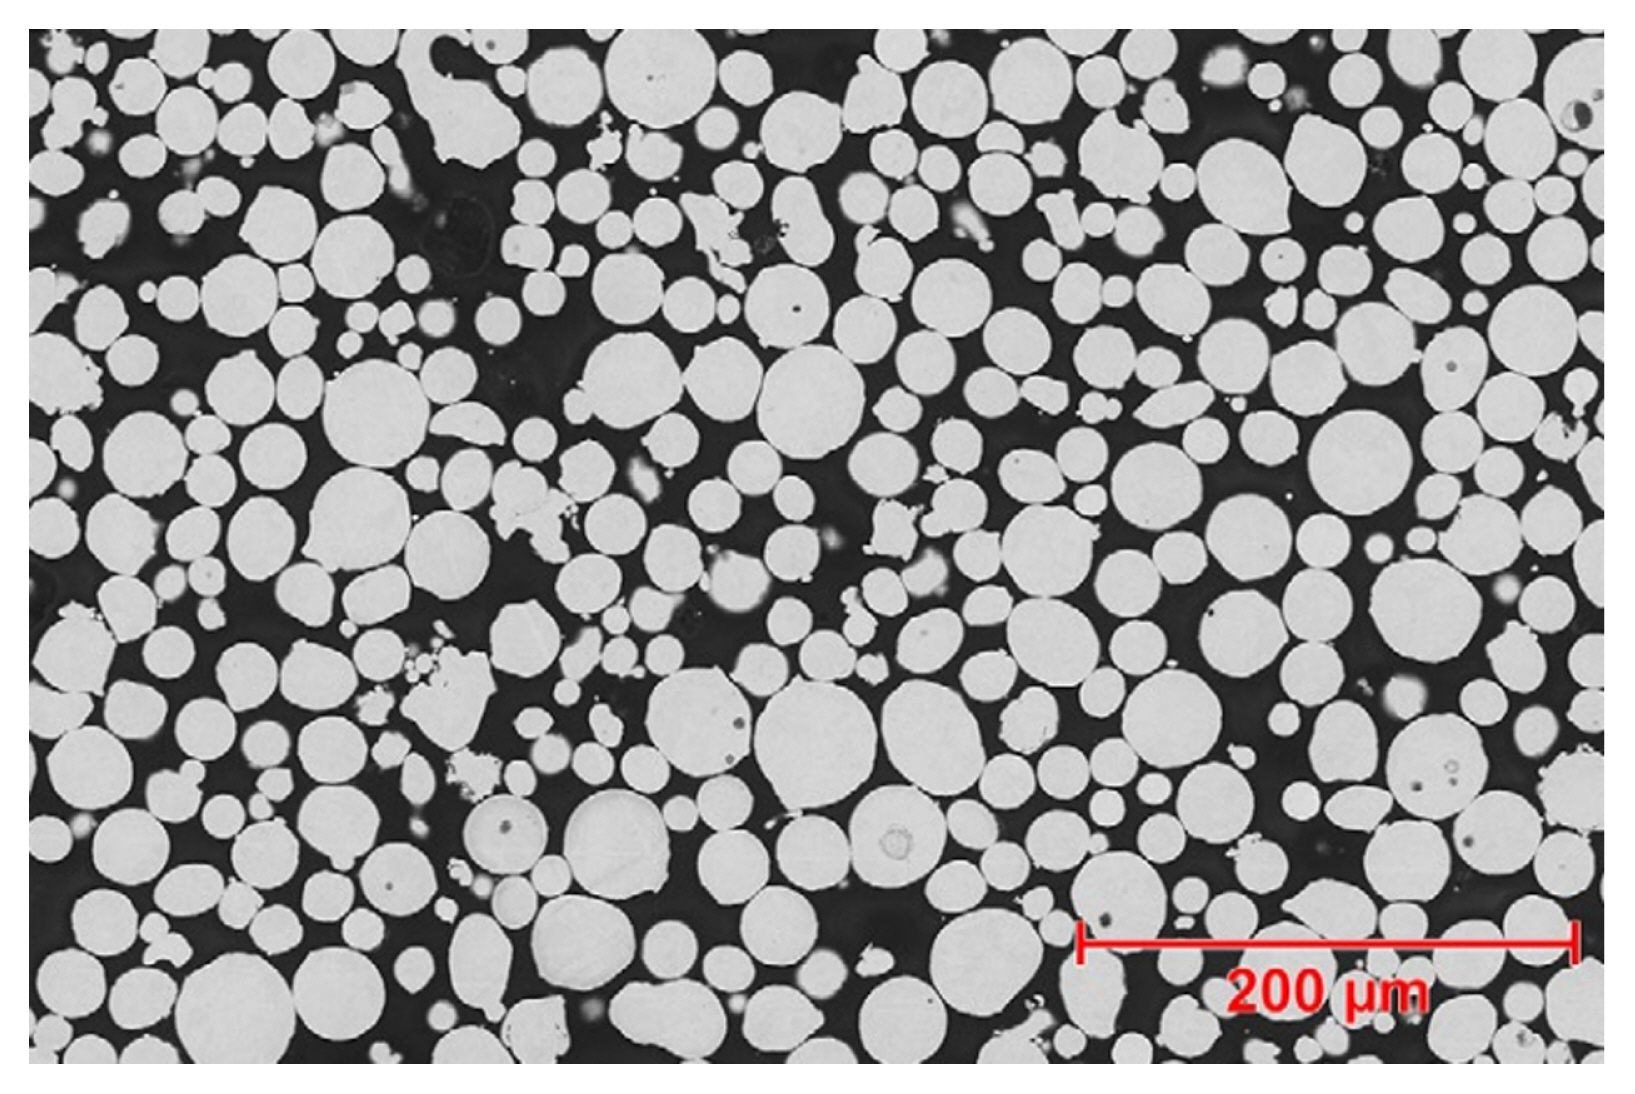
For DED experiments, two key process parameters—laser power and scanning speed—were selected. Both parameters were investigated at three levels, resulting in a total of 9 cases using a full factorial experimental approach. To ensure consistency, the experiments were replicated 4 times for all process conditions. Gas-atomized stainless steel 316L powder (Mecto 1016A, Oerlikon Metco) with a particle size ranging from 45 to 106 μm was used in the experiments, as illustrated in Fig. 4. The powder was supplied through a powder feeder with a rate of 10 g/min. Additionally, a carbon steel (AISI 1045) substrate having a size of 100 × 150 × 10 (mm) was prepared, and its material compositions are given in Table 1. Argon, an inert gas, was used for delivery and shielding gas, and it was provided at rates of 14 and 12 l/min, respectively. Additional experimental conditions are summarized in Table 2.
3.2 Multi-track Specimens
The single-layer multi-track rectangular specimens were deposited, and their size was 20 × 15 (mm). Regarding multi-track deposition, an overlap ratio of 25% was selected, situated within the stable deposition structure range of 20% to 40% [19]. To determine the overlap distance for each process condition, single-track depositions were conducted, and the overlap distance was calculated based on the width of the single-tracks measured using a laser microscope (VK-X200, Keyence). The measured widths of the single-tracks and the calculated overlap distances for each case were given in Table 3.
4 Height Profile Prediction Model
4.1 Feature Extraction
In this study, melt-pool images were utilized to predict layer height. The melt-pool is created with high heat by supplying metallic material, and it solidifies to form a layer. Several studies have analyzed the correlation between process parameters and melt-pool characteristics, revealing that they contain a variety of physical information, including internal defects and external geometry [20,21]. Specifically, the study used features related to melt-pool size, shape, position, and brightness to predict layer height in the track. Among these, some features were analyzed in the previous work of the authors’ research group, where correlations between melt-pool features, track widths, and defects were analyzed [22,23].
To predict the height based on melt-pool information, a total of 15 features related to the size, shape, position, and brightness of the melt-pool were first extracted, as shown in Table 4. The 4 features were size-related: area (representing the pixel count in the melt-pool), height and width of the ROI’s circumscribed rectangle, and height based on moment. There were 6 shape-related features: aspect ratio (ratio between the rectangle of width and height), long of ellipse (major axis length of an approximate ellipse), short of ellipse (minor axis length of an approximate ellipse), angle (degree of the major axis), extent (ratio between actual area and external boundary) and solidity (ratio of the area of the contour to the area of the convex hull of the contour). The 2 position-related features were the center x and center y, which were centered on the brightest point. Lastly, the 3 features were brightness-related: max. value, mean value, and intensity (overall brightness).
4.2 Feature Selection
When constructing prediction models using features, if irrelevant features or an excessive number of features are used, it can lead to overfitting or reduced prediction performance of the model. Thus, effective features should be selected [24,25]. In this study, permutation importance evaluation was carried out to select effective features. This method was proposed by Lio in 2001 as one of the methods used to evaluate the importance of each feature in machine learning regression models [26]. This measures the importance level of each feature for the performance outcome of the prediction model. First, select a specific feature, randomly configure the value of that feature, and then retrain the model. The changing predicted performance is then measured and compared to the original performance. A greater change in this performance indicates that the feature is more important. The results of permutation feature importance evaluation for the previously extracted 15 features are shown in Table 5. From these results, a total of 10 features were selected as effective features in order of decreasing values among those with an importance value of 0.1 or higher.
4.3 Data Reorganization and Size Standardization Process
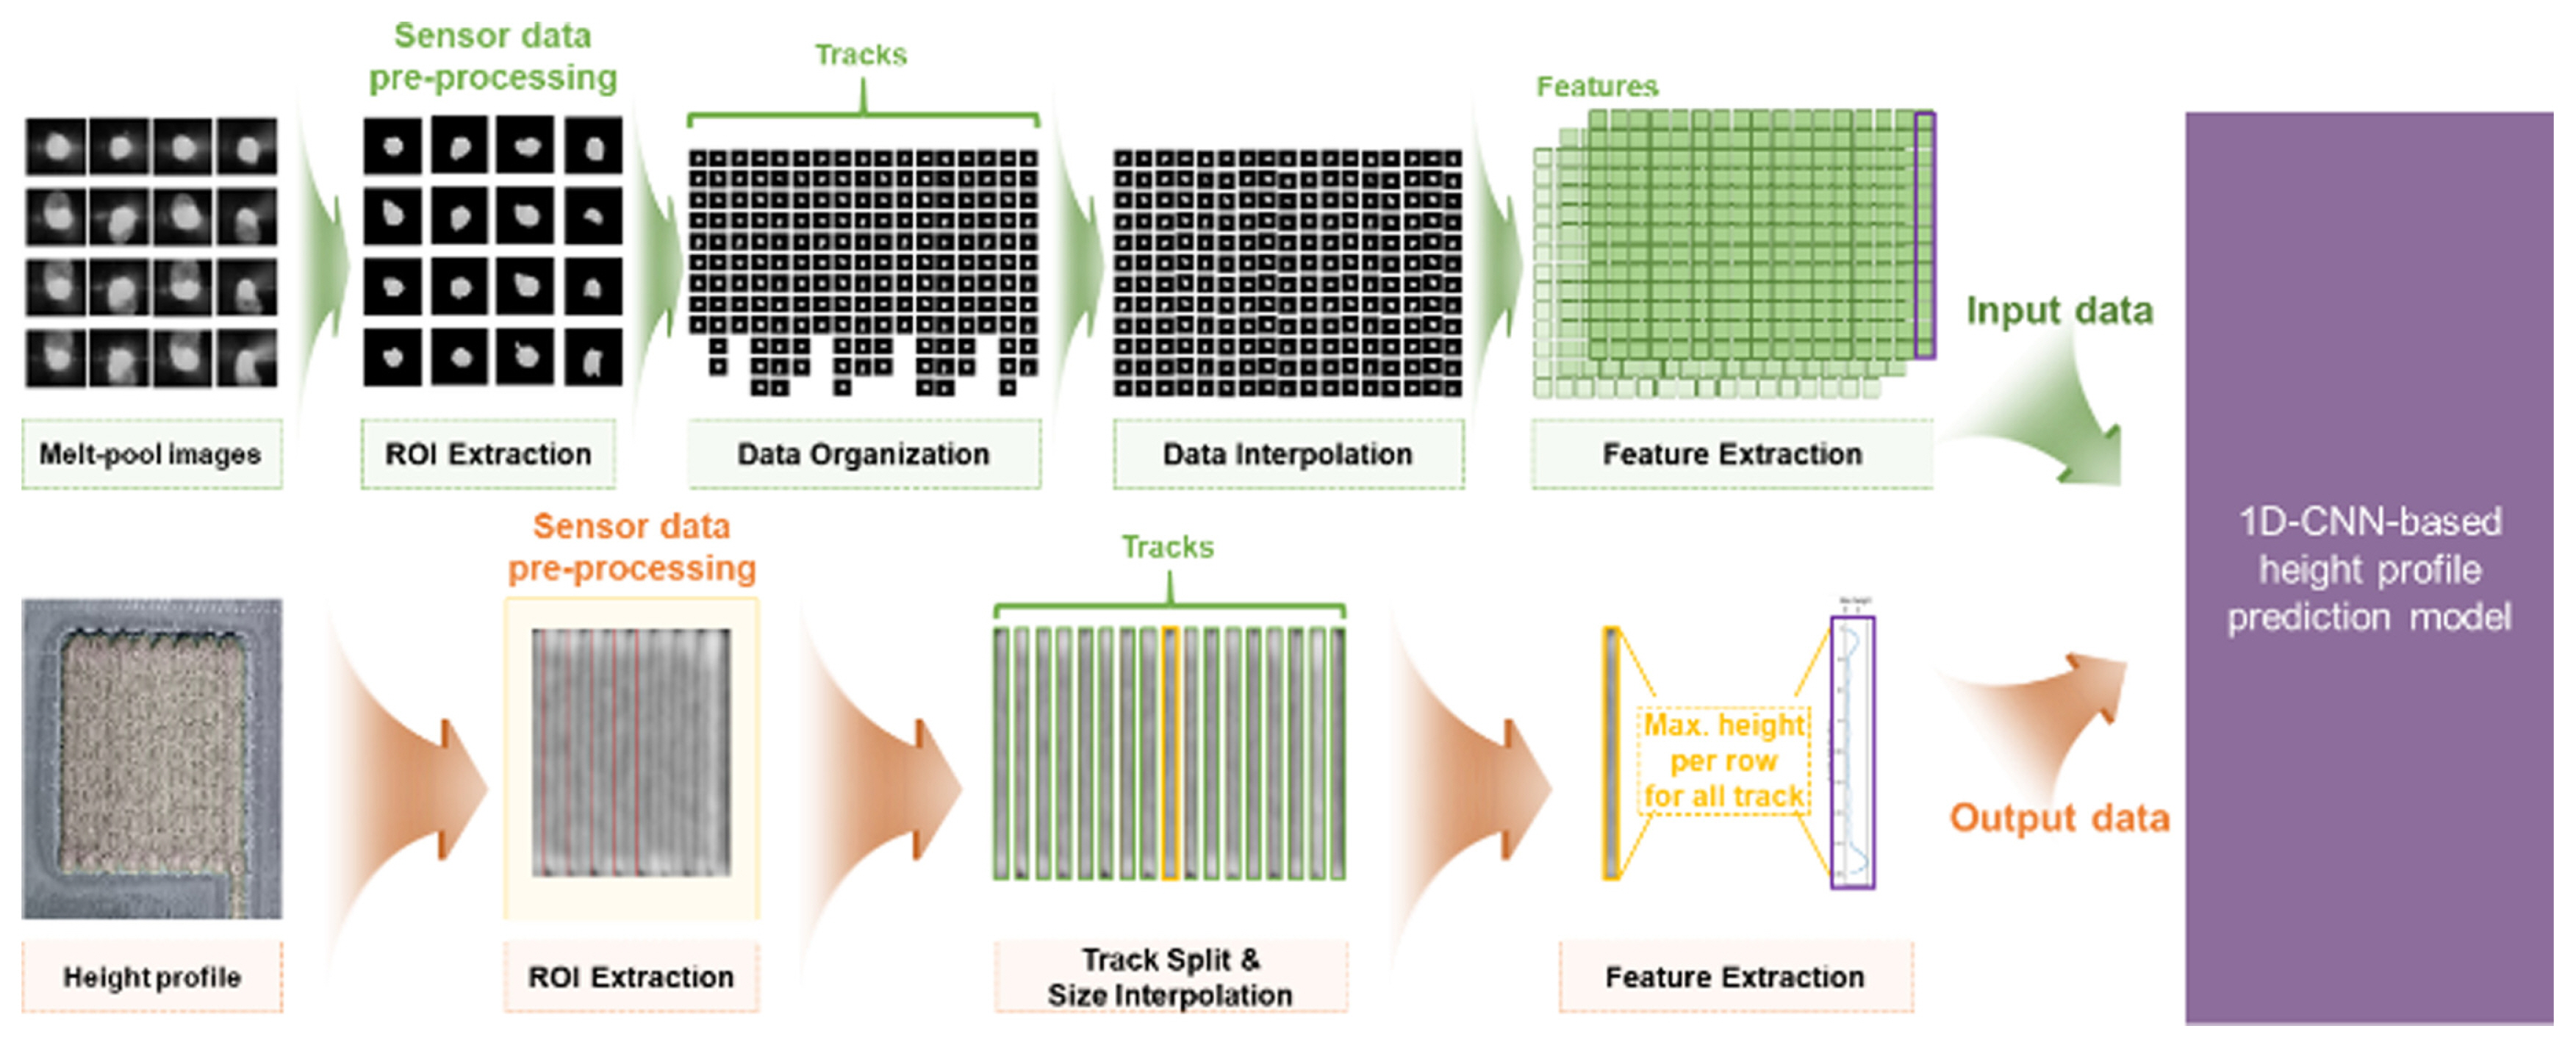
As described in Section. 3, the DED experiments were conducted for 9 cases, each replicated 4 times. During this iterative process, melt-pool images and specimen height data were collected. In particular, melt-pool images are collected in time series sequence along the toolpath. Therefore, in the case of a zig-zag path, some tracks require the order of data to be reversed. In addition, the time series information of the melt-pool image should be synchronized to the location where the image was collected through data reorganization process.
To utilize collected sensor data for machine learning model, input data sizes must be uniform. However, different scanning speeds result in the collection of different numbers of melt-pool images—fewer images for faster speeds and more for slower ones. Consequently, the number of collected melt-pool images for a track varies due to process conditions. Furthermore, the specimens’ heights and widths were different under different process conditions. Despite using the same toolpath planning for specimens that have identical dimensions, inevitable differences occur. Hence, the dimensions of specimens collected via the line scanner also differ. This causes differences in the size of rows and columns of data. To resolve these issues, the data size for each track was standardized to 200 × 1 using interpolation. This process aimed to ensure uniformity in data shapes despite varying quantities of collected melt-pool images for different process conditions and specimens with diverse heights and widths. The data-specific schematic process is depicted in Fig. 5.
As a result, pre-processed input data set (melt-pool data) has a shape of 200 × 10 per track (time series × features), while the output data set (height data) has a shape of 200 × 1 per track (time series × height). The details of total datasets are given in Table 6, which was split into a 3 : 1 ratio for training and test data. Consequently, the final data set comprised 534 data for training and 178 data for test.
4.4 1D CNN-based Height Profile Prediction Algorithm
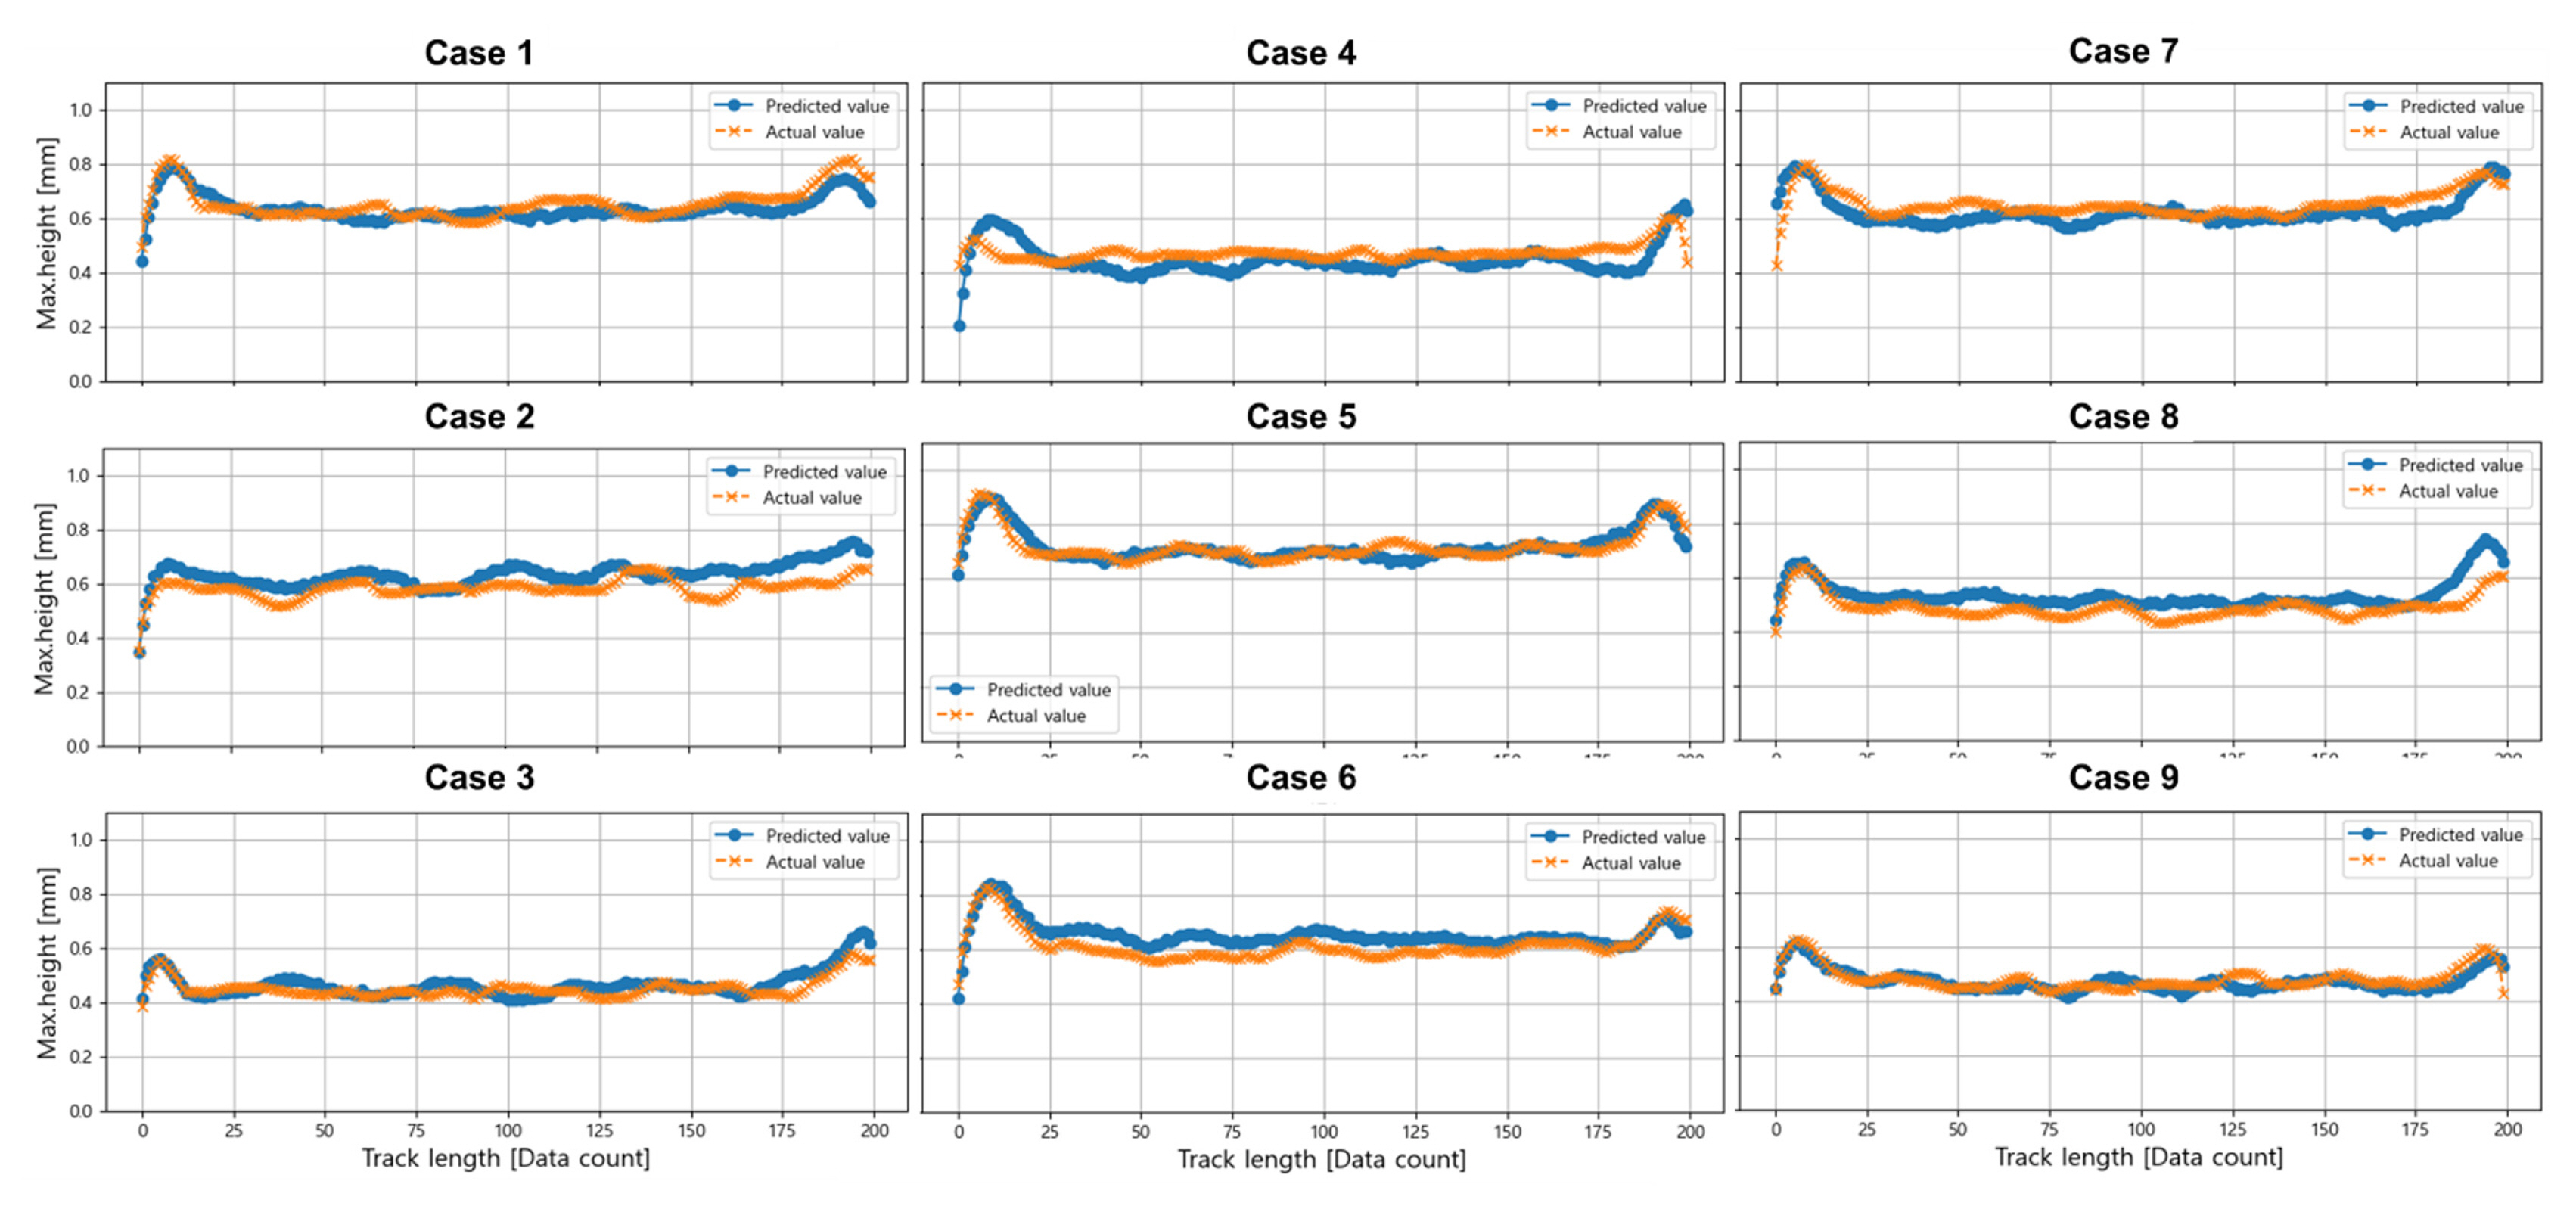
The model that predicts the height profile of the track was developed based on the 1D-CNN algorithm. The 10 features selected in section 4.2 were used as input data, and the height profile to be predicted was set as output. This model was structured with 3 convolution layers, and rectified linear unit (ReLU) and exponential linear unit (ELU), which are widely used in non-linear regression models, especially for efficient handling of large-scale data, were considered as activation functions for both the convolutional and dense layers. For model optimization, optimal hyper-parameters were explored through grid search, as shown in Table 7. Based on the mean absolute percentage error (MAPE) metric, the following hyper-parameters were selected: kernel size 2, number of neurons 64, learning rate 0.001, number of channels per layer (16, 32, 64), activation function of convolutional layer ReLU and activation function of dense layer ELU, and Adam was used as the optimizer. Ultimately, the performance of the optimized model was evaluated using test data, demonstrating a performance with a final MAPE of 9.55%. Results comparing predicted data to actual data for each case are graphically illustrated in Fig. 6.
In order to evaluate the excellence of the artificial intelligence model built in this study, model performance in similar studies was compared, as shown in Table 8. Takushima et al. [15] developed an in-process height prediction model using a coaxially installed vision camera system in the WAAM process, achieving a MAPE of 11.68%. Hsu et al. [16] built a height prediction model with a MAPE of 10.69% using a vision camera installed off-axially in the DED process. However, these methods were performed only on a single track without considering height variations due to track overlaps. Kim et al. [17] constructed a height prediction model of MAPE 12.62% using data from an IR camera installed coaxially in the DED process. Although it considered multi-track and layer toolpaths, predictions were made about the height of a specific target layer. And instead of predicting continuous heights, height prediction was performed at a specific point. In contrast, the method proposed in this study utilized off-axially installed CCD camera data in the DED process to build a prediction model with excellent performance and a MAPE of 9.55% among the compared results. In addition, the toolpath of multi-track was taken into consideration, the overlap of tracks was also reflected, and the continuous height of the stacked tracks, that is, the profile, was predicted, rather than focusing only on predictions limited to specific measurement points.
In the long term, predictions considering the profile proposed through this study can compensate for height errors generated in the previous layer through a feedback system by changing parameter values in the next layer. Additionally, this allows layer-by-layer additive quality control to achieve intended dimensions with minimal surface processing and provides thermal stabilization to enhance internal quality and mechanical properties. It can also contribute to strategic decisions about the most economical and efficient time for subtractive machining when performing hybrid processes.
5 Summary and Conclusions
This study developed a comprehensive methodology for predicting height profiles in the DED process. It involved collecting data using experimental equipment, utilizing sensors for measurements, and conducting pre-processing to apply it to a deep learning model.
Two non-contact sensors, the CCD camera and the line scanner, were utilized to obtain data, capturing melt-pool images and extracting height information from scanned areas, followed by meticulous data pre-processing. The DED experiments focused on two key process parameters: laser power and scanning speed. Employing a full factorial experimental approach, the design encompassed two factors at three levels, resulting in a total of 9 cases, each repeated 4 times. Particularly, the specimens intended for deposition were single-layer multi-track tool-paths with a rectangular configuration measuring 20 × 15 (mm).
15 features related to melt-pool size, shape, brightness, and position were extracted for the model. By evaluating permutation feature importance, 10 effective features were identified for model construction. Interpolation was applied to align data shapes for each track due to disparities in data sizes caused by different scanning speeds and specimen sizes.
The final pre-processed dataset consisted of 534 training data and 178 test data. A 1D-CNN-based height profile prediction model utilized 10 features as input and predicted height profiles as output. Following optimization through grid search, the model exhibited excellent predictive performance with a MAPE of 9.55% on test data. Results comparing predicted and actual data for each case are presented in Fig. 6.
In conclusion, a methodology has been developed to utilize machine learning models in the DED process to predict track height profiles based on melt-pool images. This is considered an important discovery for improving the efficiency of additive manufacturing processes by strengthening the quality control and regulation of DED process.

 PDF Links
 PubReader
 Full text via DOI
 Download Citation
  CrossRef TDM


