Kim, Kim, Sugita, and Mitsuishi: Surface Assessment of Transparent Glass Plate with Wavelength-Modulated Interferometry and Harmonic Phase-Iterative Method
Abstract
Multiple reflections and nonlinearity of phase modulating need to be compensated to accurately profile the surface of the glass plate using wavelength-modulated interferometry. In this study, to assess the glass plate surface using wavelength-modulated interferometry, a new phase-iterative method insensitive to the harmonic signals and nonlinear errors was developed. We developed the harmonic phase-iterative method by combining the phase-iterative method with irradiance signal considering the harmonic components. Moreover, for suppression of the harmonic-related errors in the iterative calculation, the noble pixel-selection technique and convergence formula were combined with the phase-iterative method. For estimation of the developed iterative method, we conducted the numerical simulation and assessed the glass plate surface with the Fizeau interferometer. The simulation and assessment results demonstrated that the proposed method could perform phase extraction with improved iterative calculation and suppression of the effects of the harmonics and nonlinearity.
Keywords: Fizeau interferometer ┬Ę Phase-iterative method ┬Ę Surface ┬Ę Transparent glass plate ┬Ę Wavelength-modulated interferometry
1 Introduction
Surface quality is an essential parameter of the transparent glass plate, a core component of semiconductor production technology such as the optical lithography process [ 1]. To achieve optimal exposure process in lithography equipment through the glass plate surface, nanoscale accuracy should be satisfied in surface assessment of the glass plate. Optical interferometry has been widely used for precision profiling of glass plate surfaces because it enables contactless and high-resolution assessments [ 2ŌĆō 4]. Wavelength-modulated interferometry [ 5ŌĆō 8] has been used to assess the glass plate surface since the plate is optimally aligned on the mechanical stage without the nonlinear movement of the stage. The phase difference between reference and glass plate beams was modulated regularly using the wavelength-modulated technique [ 9]. While changing the phase difference, interferograms are acquired at regular intervals, and the phase-extraction method is used for extracting the target phase [ 10ŌĆō 12]. However, the accuracy of surface assessment with wavelength-modulated interferometry suffers because of the nonlinearity of the wavelength-modulated technique and the second harmonic component generated by multiple reflections [ 13, 14]. Among the various phase-extraction methods, phase-tuning method [ 15ŌĆō 17] and phase-iterative method [ 18ŌĆō 21] have been widely used for extracting the target phase while compensating for the effects of the error sources. In the case of the phase-tuning method, the phase interval between adjacent interferograms should be constant during the wavelength modulating, and the phase-tuning algorithm is used for calculating the target phase. We previously proposed several phase-tuning algorithms based on the characteristic polynomial theory [ 22], such as the 7 N ŌĆō 6 [ 23] and 8 N ŌĆō 7 [ 24] algorithms, for interferometric surface measurements. These algorithms show superior error-suppression ability but require a large number of interferograms for surface profiling (more than 20-frame interferograms). In the recorded interferograms, the environmental effects, such as temperature variance [ 25] and floor vibration [ 26], can be accumulated, and cause systematic errors in the measurement results [ 7]. In addition, phase-tuning algorithms applied to industrial applications have used four [ 27] and five [ 28, 29] interferograms because using more than 10-frame interferograms for surface assessment is time-consuming. By combining the phase-iterative method [ 18ŌĆō 21] with the wavelength-modulated interferometry, the limitations of the phase-tuning method can be resolved. In this method, the surface profiling of the glass plate was conducted using arbitrary phase-tuned interferograms; therefore, the nonlinearity could not affect the measurement results [ 18]. However, the conventional phase-iterative method is sensitivity to the harmonic components caused by multiple reflections. Xu [ 19] first considered the effects of the harmonic component in the phase-iterative method, but measurement results contained significant ripples because of the low ability of the iterative calculation. In this study, to assess the glass plate surface using wavelength-modulated interferometry, a harmonic phase-iterative method was developed. By calculating the unknowns in the irradiance signal with the least-squares fitting, a harmonic phase-iterative method insensitive to harmonic components was derived. Then, the developed method was combined with the pixel-selection technique and harmonic convergence formula for better ability of the iterative calculation. To verify the developed iterative method, we conducted numerical simulation and assessed the glass plate surface by wavelength-modulated Fizeau interferometer. The simulated and experimental results were discussed with respect to RMS phase error and to residual ripples and standard deviation of the surface profiling, respectively.
2 Irradiance Signal in Wavelength-Modulated Interferometry
To conduct surface assessment of the glass plate, a laser interferometer with a reference surface should be considered. Fig. 1 depicts the laser interferometer, where D indicates the air-gap distance between the glass plate and reference surfaces. When the wavelength-modulated technique changes the wavelengths of the laser source, multiple reflections from two reflective surfaces in Fig. 1 generate the harmonic components of the signal. The irradiance signal of the interferogram, including the harmonic components, can be expressed as where Sxy0 is the DC component, and Sxyz, axz, and fyz are the amplitude, phase-tuned parameter, and phase of harmonic component, respectively. In coefficients of the irradiance signal, the subscript x indicates the x-th phase-tuned interferogram (x = 1, 2, ŌĆ”, M), y is a pixel location on the interferogram (y = 1, 2, ŌĆ”, L), and z is the order of the harmonic component (z = 1, 2, ŌĆ”, P).
The phase-tuned parameter should change regularly while implementing the wavelength-modulated technique. However, because of the nonlinearity of the piezoelectric transducer (PZT) in the wavelength-modulated technique, the phase-tuned parameter changes nonlinearly [ 14]. Therefore, assessing the glass plate surface is affected by the correlated errors between the harmonics and nonlinearity [ 7, 24, 30]. For precision profiling of the glass plate surface, a phase-extraction method should suppress the correlated error between harmonic components and nonlinearity while determining the target phase fy1.
3 Harmonic Phase-Iterative Method
3.1 Determination of Phase and Phase-Tuned Parameter
The phase-iterative method is applied to the wavelength-modulated interferometry for phase extraction. Since the arbitrary phase-tuned interferograms are applied to the phase-iterative method, nonlinear phase-tuned errors do not result in systematic errors while extracting the target phase [ 18ŌĆō 21]. To compensate for the correlated errors between the harmonic components and nonlinearity, a noble phase-iterative method is derived using the irradiance signal considering the harmonic components and partial least-square fitting. In Eq. (1), the irradiance signal considering the harmonic components consists of ML available equations and ML + MLP + MP + LP unknowns, corresponding to Sxy0, Sxyz, axz, and fyz, respectively. For instance, since the parameter Sxy0 is related to the phase-tuned interferograms ( x = 1, 2, ŌĆ”, M) and pixel location on the interferograms ( y = 1, 2, ŌĆ”, L), the maximum number of cases of Sxy0 is ML. Since the number of unknowns is larger than that of usable equations, partial least-squares fitting is used in phase extraction [ 18]. For phase extraction, the phase-iterative method assumes that Sxy0 and Sxyz, defined in Eq. (1), contain only pixel-to-pixel variation. Based on this assumption, the irradiance signal can be given to where the coefficients Ay, Byz, and Cyz correspond to Sy0, Syzcos fyz, and Syzsin fyz, respectively. When the phase-tuned parameter axz is the given value, Eq. (2) consists of L + 2 LP unknowns. The unknowns can be calculated if M Ōēź 1+ 2 P because Eq. (2) is composed of ML available equations. Based on this condition, the number of frames is greater than or equal to five for phase extraction with suppression of the second harmonics ( M = 5 and P = 2). To determine the coefficients Ay, Byz, and Cyz, the least-squares error associated with the frame number Ey is given to where Ixye is the experimental irradiance signal. Through least-squares fitting, Ay, Byz, and Cyz were determined by minimizing the Ey:
Above equation can be expressed as
where
By solving the Eq. (5)Byz and Cyz are determined in terms of the pixel position and harmonic component. The phase of the z-th harmonics is calculated as: The determined phase is used as the input in the iterative cycle to determine the phase-tuned parameter.
To determine the phase-tuned parameter, it is assumed that Sxy0 and Sxyz, defined in Eq. (1), contain only frame-to-frame variation. From this assumption, Eq. (1) can be rewritten as where AŌĆ▓x, BŌĆ▓xz, and CŌĆ▓xz correspond to Sx0, Sxzcos axz, and - Sxzsin axz, respectively. When phase fyz is the known value, Eq. (10) consists of M + 2 MP unknowns. The unknowns can be determined if L 3 1 + 2 P because Eq. (10) is comprised of ML usable equations. For determining coefficients AŌĆ▓x, BŌĆ▓xz, and CŌĆ▓xz, the least-squares error associated with the pixel EŌĆ▓x is expressed as
AŌĆ▓x, BŌĆ▓xz, and CŌĆ▓xz are determined by minimizing the EŌĆ▓x with the least-squares fitting:
where
By solving the Eq. (13), BŌĆ▓xz and CŌĆ▓xz are obtained in terms of each phase-tuned interferogram and harmonic component, respectively. The phase-tuned parameter can then be calculated as follows: The above parameter is used as the input of the iterative cycle for phase extraction.
3.2 Convergence Formula of Phase-Iterative Method
Due to the multiple reflections in the laser interferometer, the phase-tuned parameter and phase in the irradiance signal are affected by the first harmonics as follows: axz = zax1 and fyz = zfy1. Owing to these relationships, a harmonic-related error can occur in the least-squares fitting. This error can cause the divergence of the least-square fitting in Eqs. (6) and (14). To suppress the harmonic-related error, the harmonic convergence formula, expressed following Eq. (18), is proposed. where z is the preset threshold of the iterative calculation and k is the number of iterative cycles.
In accordance with above formula, the calculation results of proposed iterative method were estimated by the calculated axz. Phase-tuned parameter and phase can be determined via phase-iterative method without harmonic-related error when all calculated axz ( x = 1, 2, ŌĆ”, M and z = 1, 2, ŌĆ”, P) satisfy above formula. For instance, when the irradiance signal includes up to the second harmonic ( P = 2), the phase-iterative method requires at least five interferograms to identify the unknowns ( z = 1, 2 and x = 1, 2, ŌĆ”, 5). To determine the phase-tuned parameter and phase, ax1 and ax2 should satisfy Eq. (18). This new convergence formula increases the amount of iterative calculation, however, since the least-squares fitting uses every pixel on the phase-tuned interferogram. For better performance of iterative calculation, a pixel-selection technique was applied. In this technique, pixels are selected with a constant distance on the interferogram. Using these selected pixels, the local phase-tuned parameter is determined. The example of the pixel-selection technique is represented in Fig. 2. The DC component and amplitude in these pixels also contain both pixel and frame variations due to the nonuniformity in the irradiance signal of the original interferogram [ 21]. Thus, the pixel-selection technique is applicable to the calculation of the phase and phase-tuned parameters using the assumptions. To identify the unknowns, the number of pixels used in this technique must be larger than or equal to 1 + 2 P. The properties of the proposed technique were determined before conducting the iterative cycle. The proposed convergence condition and technique enable the proposed iterative method to be resistant to harmonic-related errors, thereby enhancing the ability of the iterative calculation.
3.3 Phase-Extraction Process
The proposed iterative method includes five steps for phase extraction. Fig. 3 shows a flow chart of the proposed iterative method. The proposed iterative method is introduced in detail as follow:
Step 1. The pixel arrangements of the pixel-selection technique are preset in accordance with the number of unknowns. Step 2. Using the pixel-selection technique and pixel-to-pixel variation, the phase fyzk on the selected pixels was calculated with Eqs. (5) and (9) using the phase-tuned parameter axyk ŌĆō 1 calculated. For the first iterative cycle, the phase-tuned parameter of the first and z-th harmonics are predetermined as follows: 0 < ax10 < 2p and axz0 = zax10. Step 3. Using the pixel-selection technique and frame-to-frame variation, the phase-tuned parameter axyk on the selected pixels was calculated with Eqs. (13) and (17) using the phase calculated in previous step. Step 4. Results of the iterative calculation are estimated by the harmonic convergence formula. If the calculated phase-tuned parameter satisfies the predetermined threshold (e.g., z = 10ŌłÆ5 rad), axzk is the final parameter. Otherwise, the phase-tuned parameter must be recalculated by repeating steps 2 and 3 until recalculated value satisfies the convergence formula. Step 5. Using all pixels of the original interferograms and pixel-to-pixel variation, the target phase fy1 was calculated with Eqs. (5) and (9) using the final phase-tuned parameter axzk. Then, the surface of the glass plate was determined using an unwrapping technique.
4 Numerical Simulation
We carried out a numerical simulation for evaluation of the phase-extraction ability regarding the interferograms with arbitrary configuration, and compared the simulation results with those of conventional phase-extraction methods. Table 1 lists the phase-extraction methods used for performance comparison. We implemented the simulation using MATLAB with 16 GB RAM and an Intel(R) Core (TM) i7-7700 CPU. In this simulation, the size of the interferogram was 300 ŌĆś300 pixels. We used up to the 14th-order of a Zernike polynomial [ 31] to generate the target phase. Using the generated phase, the irradiation signal contains up to the second harmonics. Moreover, the DC component and amplitude of the irradiance signal were set as follow: where the frame-to-frame variations are expressed by Nx0 and Nx, which are arbitrary values between 0.9 and 1, and the pixel-to-pixel variations are express by g and h (ŌłÆ1 Ōēż g Ōēż 1, ŌłÆ1 Ōēż h Ōēż 1). In addition, the phase-tuned parameter contains phase-tuned error and is defined as
where a0g1 is the ideal phase-tuned parameter, and y0 and y1 are linear and nonlinear phase-tuned error coefficients where y0 = 0.05 and y1 = 0.03. Then, a0g1 is adjusted as follows: a0x1 = [0 1 2 3 4] for phase-iterative methods and a0x1 = p( x ŌĆō 1)/2 for phase-tuning method ( x = 1, 2, ŌĆ”, M). Moreover, each interferogram contained white Gaussian noise with a mean of zero to consider the environmental effects. The reference phase and interferogram of the simulation is depicted in Fig. 4. For phase extraction, the same phase-tuned parameter of the first harmonics is used for the first iterative cycle of three PIAs listed in Table 3, and the preset threshold z was 10 ŌłÆ5 rad. In addition, HPIA used 40 ├Ś 40 pixels of the pixel-selection technique.
Fig. 5 shows the calculated phases using phase-extraction methods. The maximum value of the calculated phases correspond to the characteristics of the phase-extraction methods affected by the error sources in the numerical simulation. Furthermore, the RMS phase error of the simulated results are shown in Table 2. HPIA shows outstanding performance according to the smallest RMS phase error in Table 2. The RMS phase error of the HPIA resulted from the white Gaussian noise and the RMS phase error can be affected by the pixel size of the interferogram in the numerical simulation. Furthermore, the calculation time of HPIA was 0.714 s, which was much faster than those of AIA (3.314 s) and XuŌĆÖs PIA (4.737 s). It is demonstrated that the HPIA can perform the phase extraction with compensation for the harmonic components and phase-tuned errors and improved iterative calculation.
5 Experiment
5.1 Wavelength-Modulated Fizeau Interferometer
The surface assessment of the transparent glass plate, where geometric thickness and diameter are 22 mm and 100 mm, was performed using the five interferograms acquired by wavelength-modulated Fizeau interferometer (Fujifilm G102). Fig. 6 depicts the optical setup of the wavelength-modulated Fizeau interferometer. During surface assessment, the temperature of the laboratory maintained 25┬░C (┬▒0.1┬░C). In Fig. 6, a Littman-type diode laser (TLB-6300-LN; New Focus, San Jose, CA, USA) was used in the wavelength-modulated Fizeau interferometer [ 32]. The beam from the laser source is divided into two paths by a beam splitter: one to the wavelength meter (Anritsu MF9630A) and the other to the Fizeau interferometer. We used a stabilized He-Ne laser to calibrate the wavelength with a 10 ŌłÆ7 accuracy. The beam sent to the interferometer illuminates the reference and glass plate surfaces by the collimator lens, and the interference of two reflected beams from the reference and glass plate surfaces generates the interferogram. The accuracy of the reference surface was approximately ╬╗/20 (~32 nm). While changing wavelengths using the wavelength-modulated technique, a charge-coupled device (CCD) camera saves the interferograms ith 640 ├Ś 480 pixel resolution and 25 mm pixel size. Figs. 7 and 8 show the glass plate on the mechanical stage and the raw interferogram of the glass plate observed by the CCD camera.
5.2 Surface Assessment of Transparent Glass Plate
We assessed the glass plate surface using harmonic phase-iterative method with five interferograms. When modulating the wavelength from 632.874 nm to 632.919 nm, five experimental interferograms are acquired by the CCD camera, as shown in Fig. 9. The wavelength meter in Fig. 6 checked the value of the wavelength. The pixel-selection technique is preset to 40 ├Ś 40 pixels on each phase-tuned interferogram in accordance with the number of experimental interferograms and unknowns in the irradiance signal. The local phase-tuned parameter used for extracting the target phase is calculated through Steps 2 to 4 of the harmonic phase-iterative method. Then, using Step 5, the target phase was calculated. After the iterative cycle, the unwrapping process was performed to obtain an accurate surface of the glass plate.
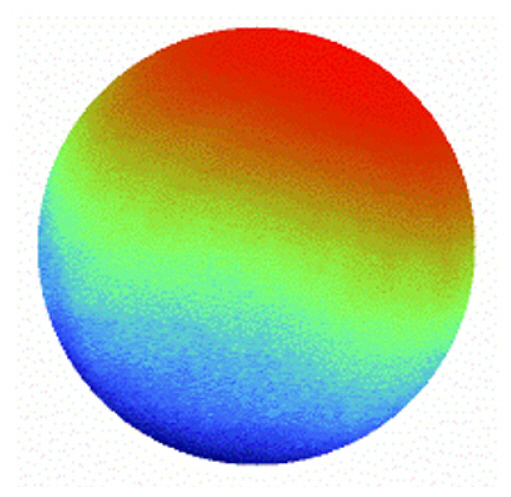
Fig. 10 shows the surface of the glass plate assessed by the proposed iterative method. Without the unwrapping process, the calculation time for surface assessment was 0.222 s. The maximum amplitude of the surface assessment is the average value of the five experiments. In addition, since the accuracy of surface assessment should be maintained during the mass production process of the semiconductor industry, we calculated the standard deviation of the surface assessment. The standard deviation of the five times surface assessments was 1.885 nm. This standard deviation of the surface profiling resulted from the higher harmonics ( z Ōēź 3), residual nonlinearity of the wavelength-modulated technique, and the characteristics of the CCD camera, such as pixel resolution and pixel size. We calculated the total accuracy of experiments, 32.1 nm, by the root square sum of the accuracy of the reference surface of 32 nm and the standard deviation of surface assessment of 1.885 nm.
6 Discussion
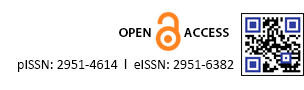
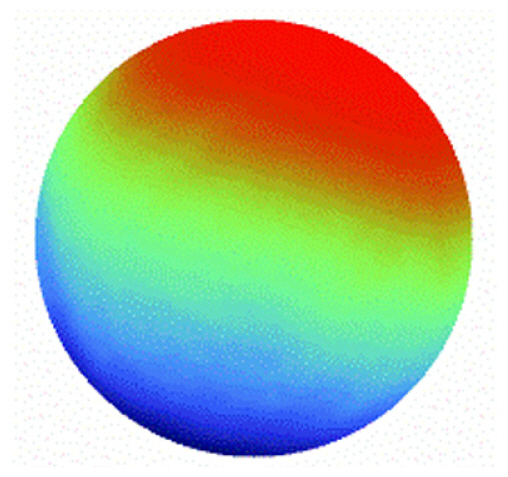
A comparison with conventional phase-extraction methods listed in Table 1 is performed to estimate the experimental results of the proposed iterative method. First, we conducted a comparison among phase-iterative methos using the AIA [ 18] and XuŌĆÖs PIA [ 19]. The glass plate surfaces assessed by HPIA, AIA, and XuŌĆÖs PIA are depicted in Figs. 11(a), 11(b), and 11(c), respectively. In contrast to Figs. 11(a) and 11(c), 11(b) contains ripples because the AIA is sensitive to the second harmonic component. In addition, white dotted lines on the glass plate surfaces indicates the 200th row and column and the surface profiles at this lines are shown in Figs. 11(d) and 11(e). Owing to compensation for the second harmonics and improved iterative calculation, the profile by the HPIA shows smaller fluctuations than those by AIA and XuŌĆÖs PIA. The standard deviation of the surface assessment for AIA and XuŌĆÖs PIA were 10.007 nm and 8.325 nm due to large fluctuations. In addition, the iterative calculation time of the AIA and XuŌĆÖs PIA without unwrapping process were 11.287 s and 27.334 s. Next, to compare HPIA and with the phase-tuning method, four-frame [ 27] and five-frame [ 28, 29] PTAs were used for surface profiling of the glass plate. Figs. 12(a), 12(b), and 12(c) represents the surfaces of the glass plate calculated by HPIA, four-, and five-frame PTAs. In addition, white dotted lines on the glass plate surfaces indicates the 200th row and column and the surface profiles at this lines are shown in Figs. 12(d) and 12(e). Since the two PTAs cannot eliminate the effects of nonlinearity, the profile by HPIA shows the smaller fluctuations that those by two PTAs. Because of the sensitivity to nonlinearity, the standard deviation of the surface assessment for four- and five-frame PTAs were 10.260 nm and 9.131 nm.
Table 3 shows the summary of the abilities of the phase-extraction methods in the experiment results. Compared to the simulation results listed in Table 2, the proposed HPIA shows superior performance compared with other methods in accordance with the smallest RMS phase error and standard deviation. Except for the HPIA, other phase-extraction methods show different trends in the results of the simulations and experiments. For instance, although the RMS phase error of the AIA is smaller than that of the five-frame PTA, the standard deviation of the AIA is larger than that of the five-frame PTA. This is because the numerical simulation cannot consider all environmental conditions of the laboratory and the results of the simulations and experiments can be affected by the configuration of the interferogram.
7 Conclusion
We proposed a harmonic phase-iterative method to assess the glass plate surface by a wavelength-modulated Fizeau interferometer. To compensate for the effects of the harmonics, the irradiance signal considering the harmonics was applied to the phase-iterative method. In addition, we combined the proposed iterative method with the pixel-selection technique and harmonic convergence formula, which suppressed the harmonic-related error and improved the ability of iterative calculation. For estimation, we conducted a numerical simulation and assessed the glass plate surface using Fizeau interferometer with wavelength-modulated interferometry. In accordance with the simulated results, RMS phase error of the proposed method was the smallest among the phase-extraction methods. Moreover, results of the surface assessment demonstrated that the proposed iterative method showed the smallest standard deviation of the surface assessment (1.885 nm) among the phase-extraction methods. Hence, the newly developed iterative method is expected to enhance the instrumentation and process monitoring in the semiconductor industries since this method can perform the surface assessment of glass plates with the improved ability of the iterative calculation and suppression of the influences of the correlated error between harmonics and nonlinearity.
Acknowledgement(s)
This study was supported by the National Research Foundation of Korea (NRF) grant funded by the Korean government (MSIT) (2021R1A2C1012658).
Fig.┬Ā1
Laser interferometer with reference surface 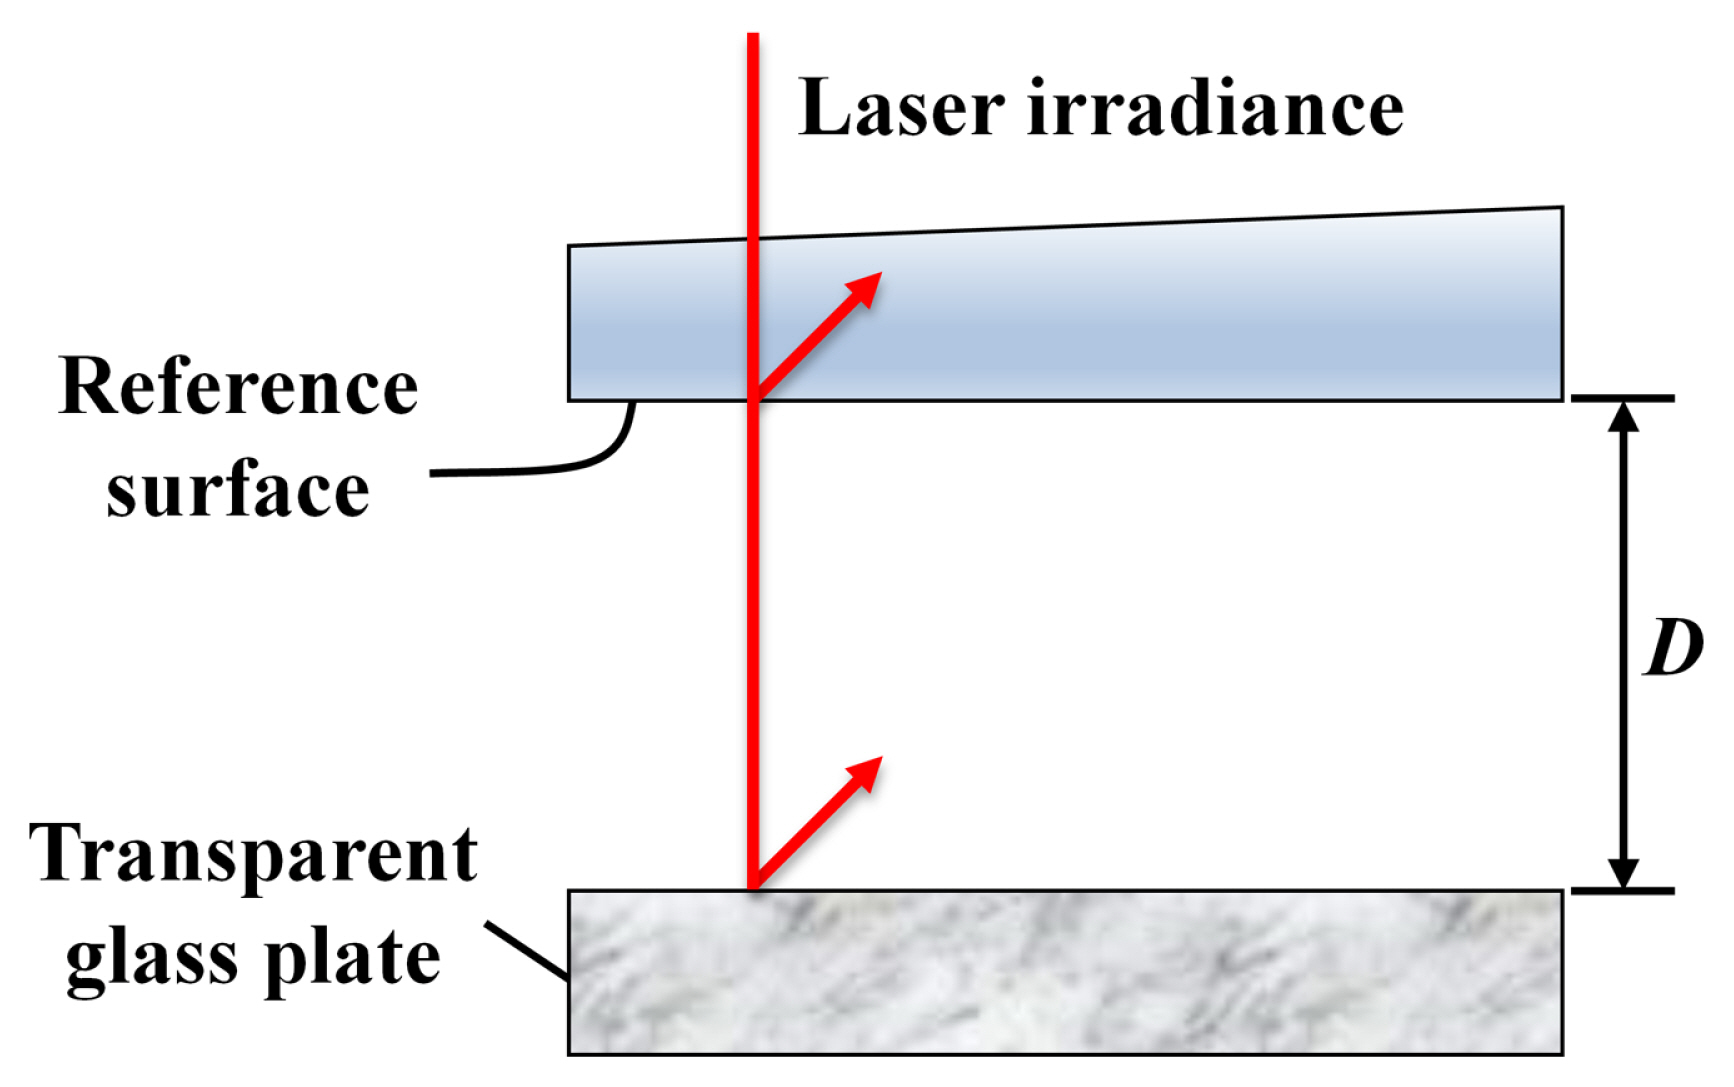
Fig.┬Ā2
(a) Interferogram of glass plate and (b) Example of pixel-selection technique 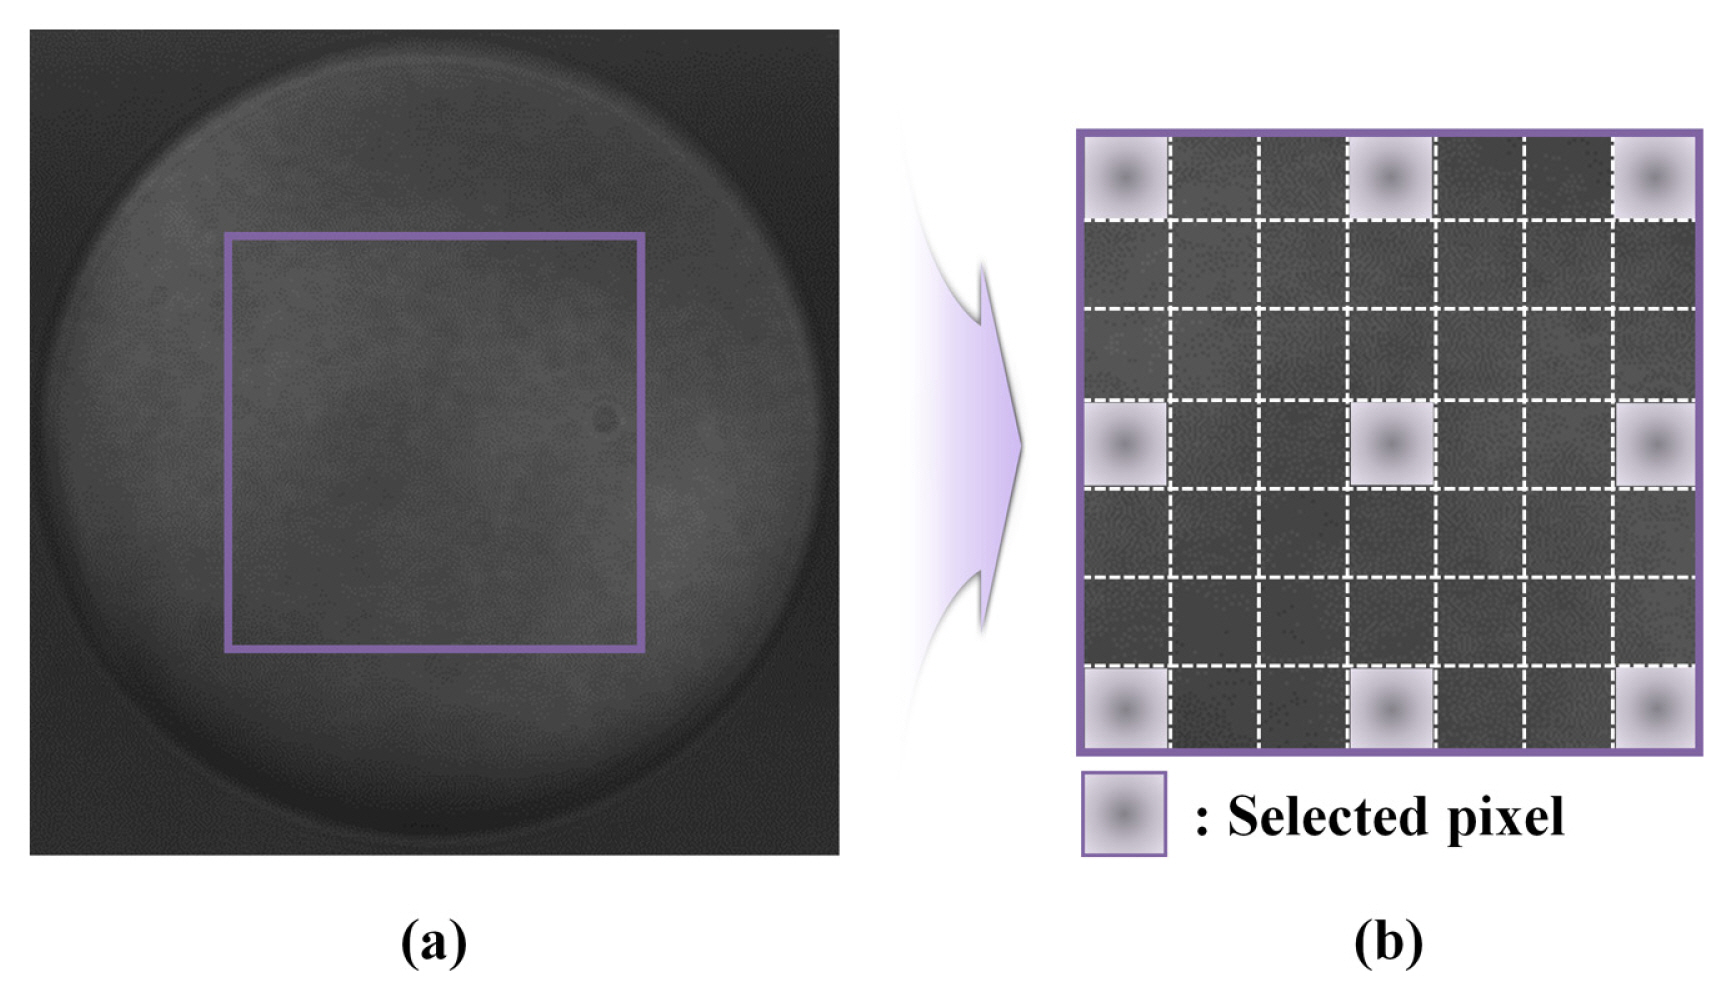
Fig.┬Ā3
Flow chart of harmonic phase-iterative method. Steps 2 and 3, marked with a red line, use the selected pixels and Step 5, marked with a blue line, uses all pixels on the experimental interferogram 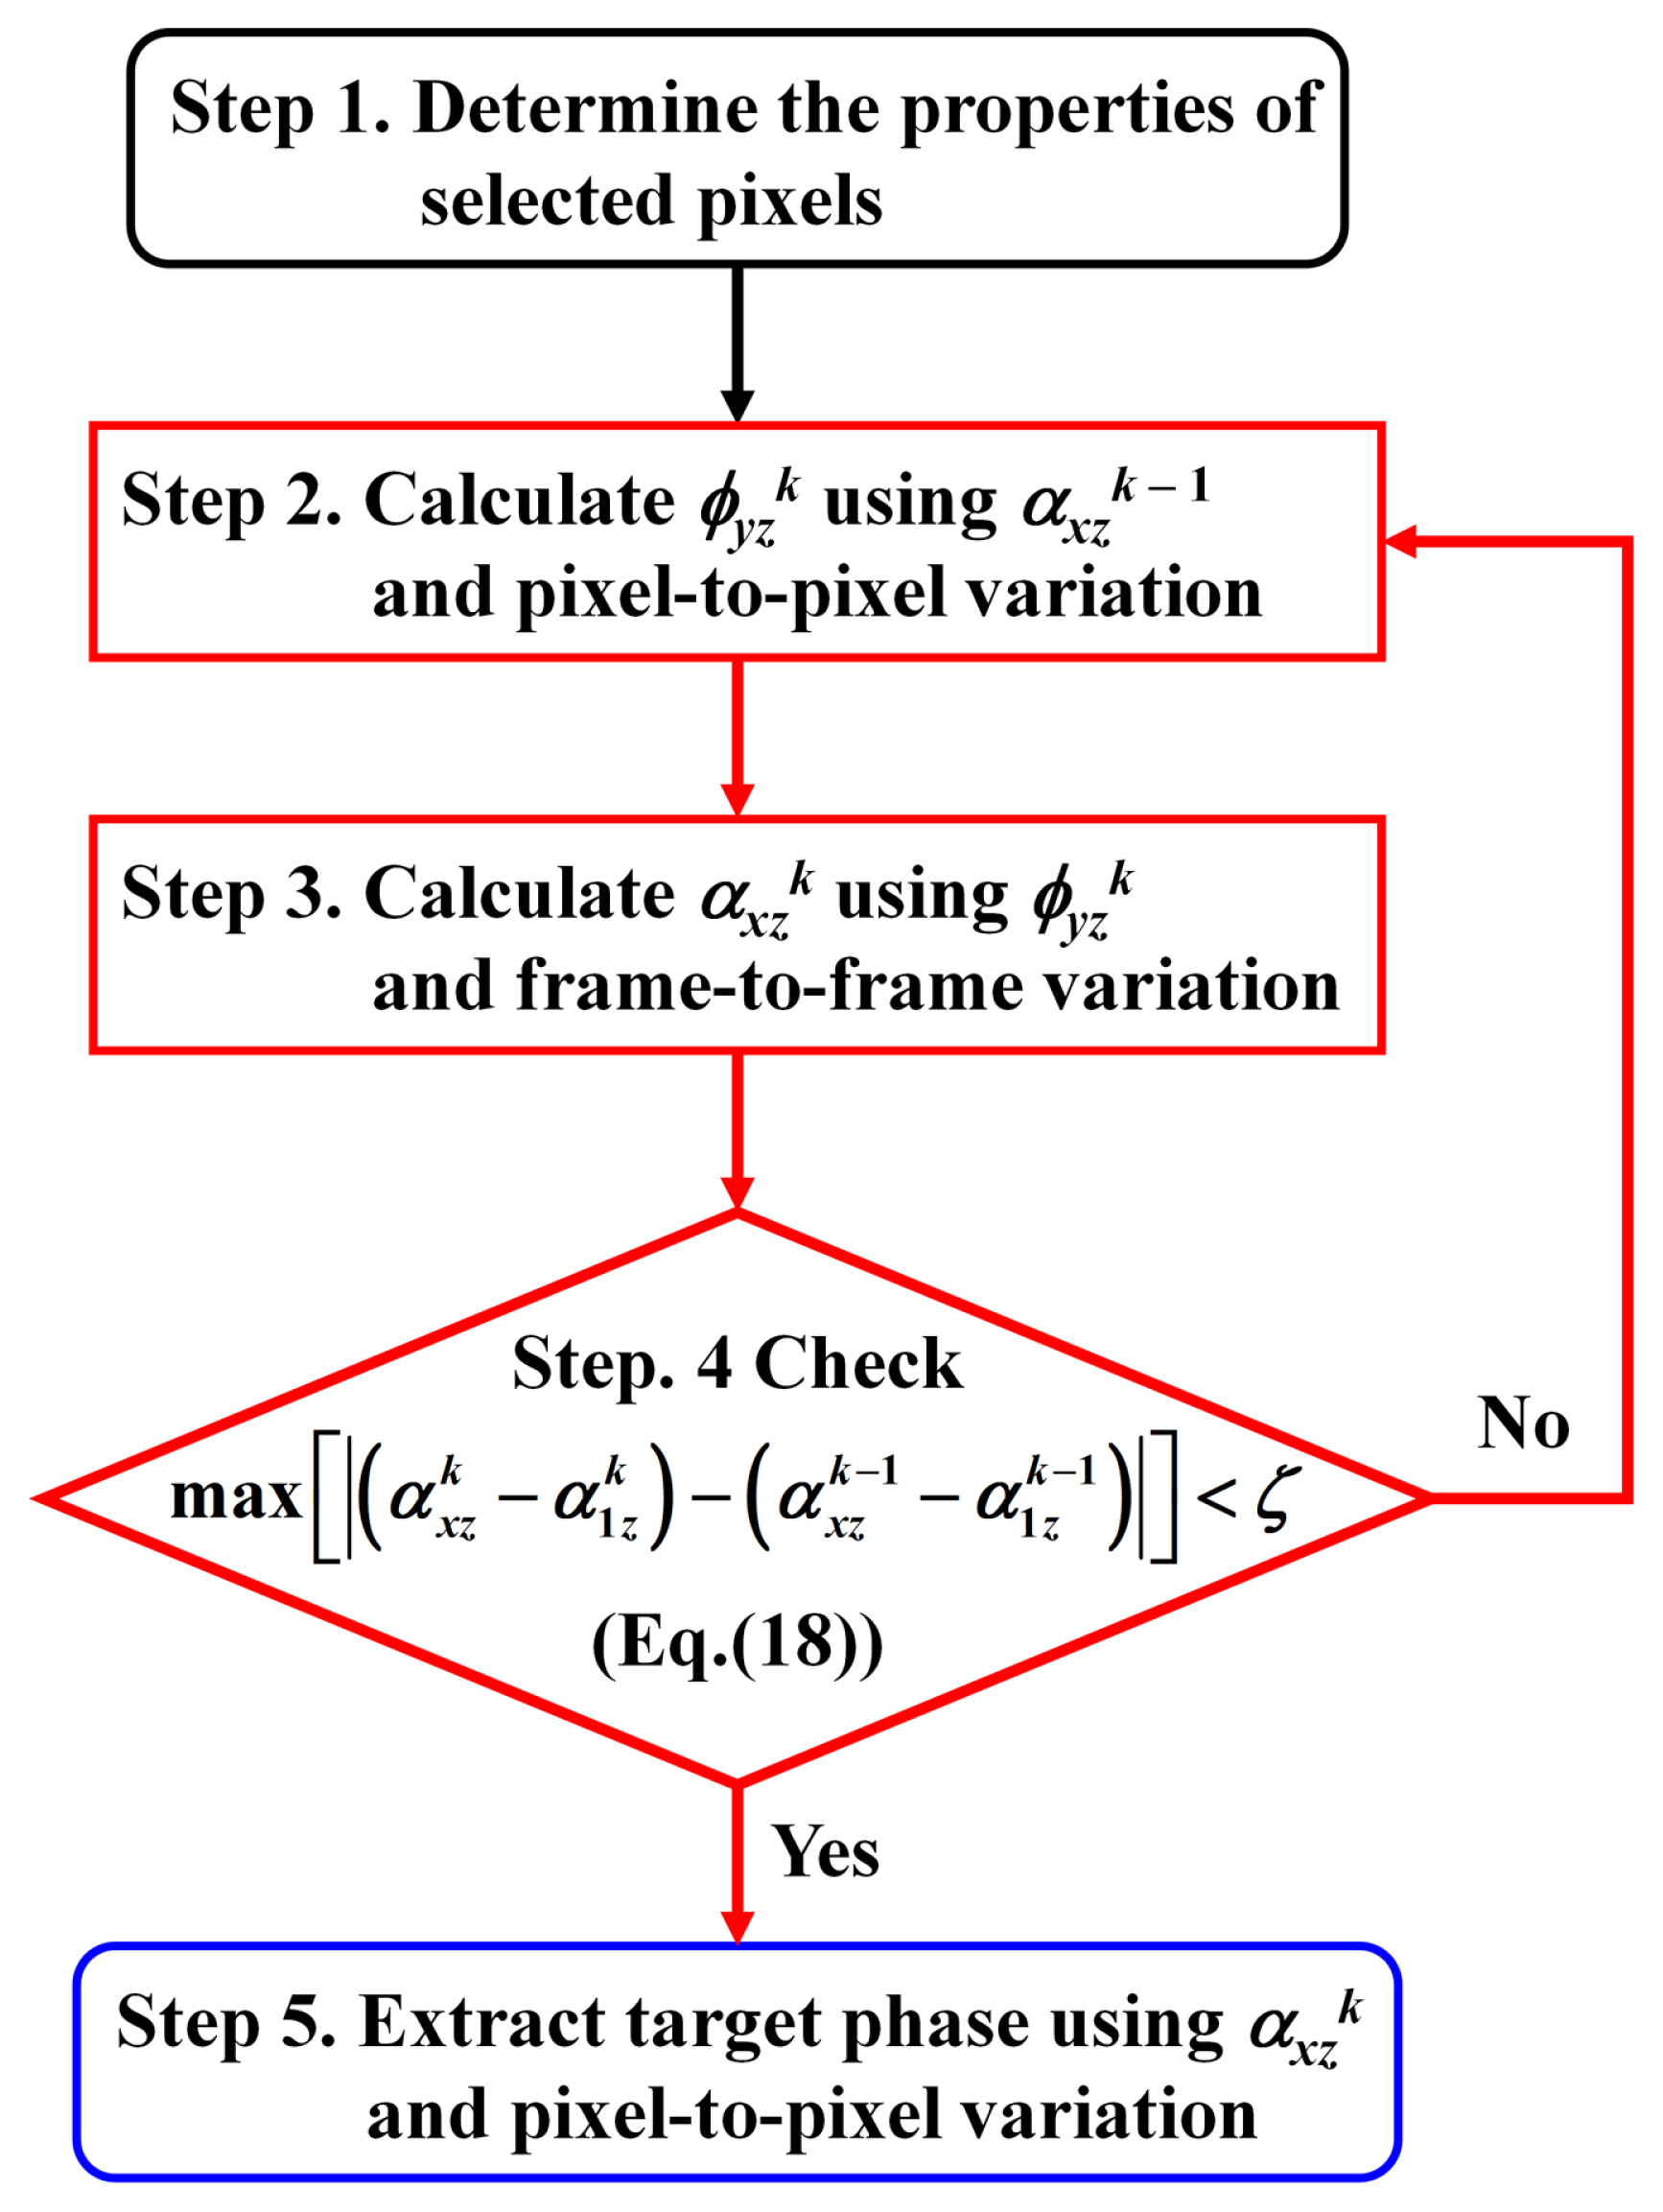
Fig.┬Ā4
(a) Reference phase generated using up to 14th-order terms of the Zernike polynomial and (b) Interferogram, where the amplitude is the normalized value 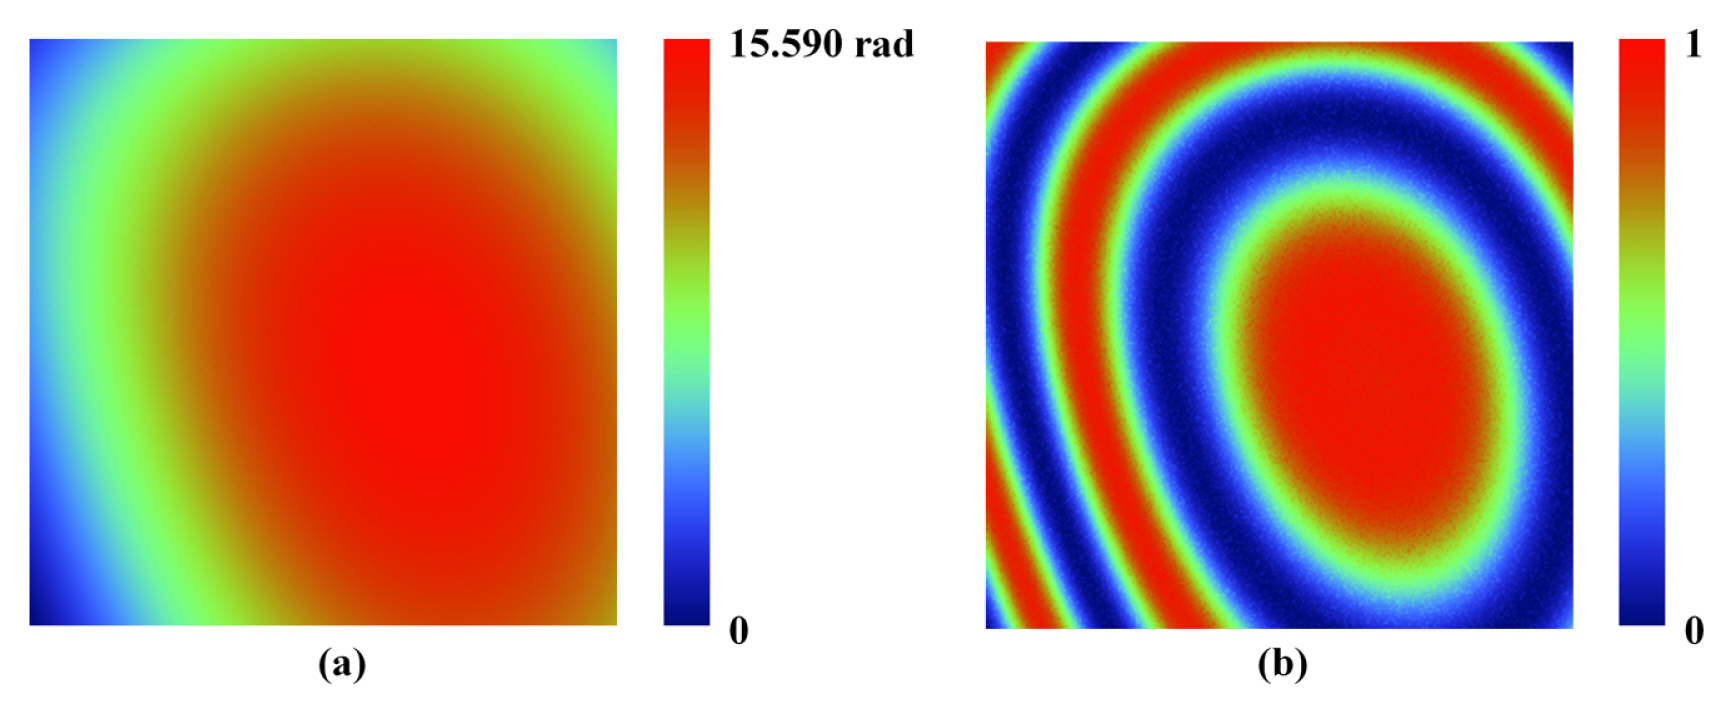
Fig.┬Ā5
Simulation results of target phase. (a)ŌĆō(e) are the calculated target phase using HPIA, AIA, XuŌĆÖs PIA, four-frame PTA, and five-frame PTA, respectively 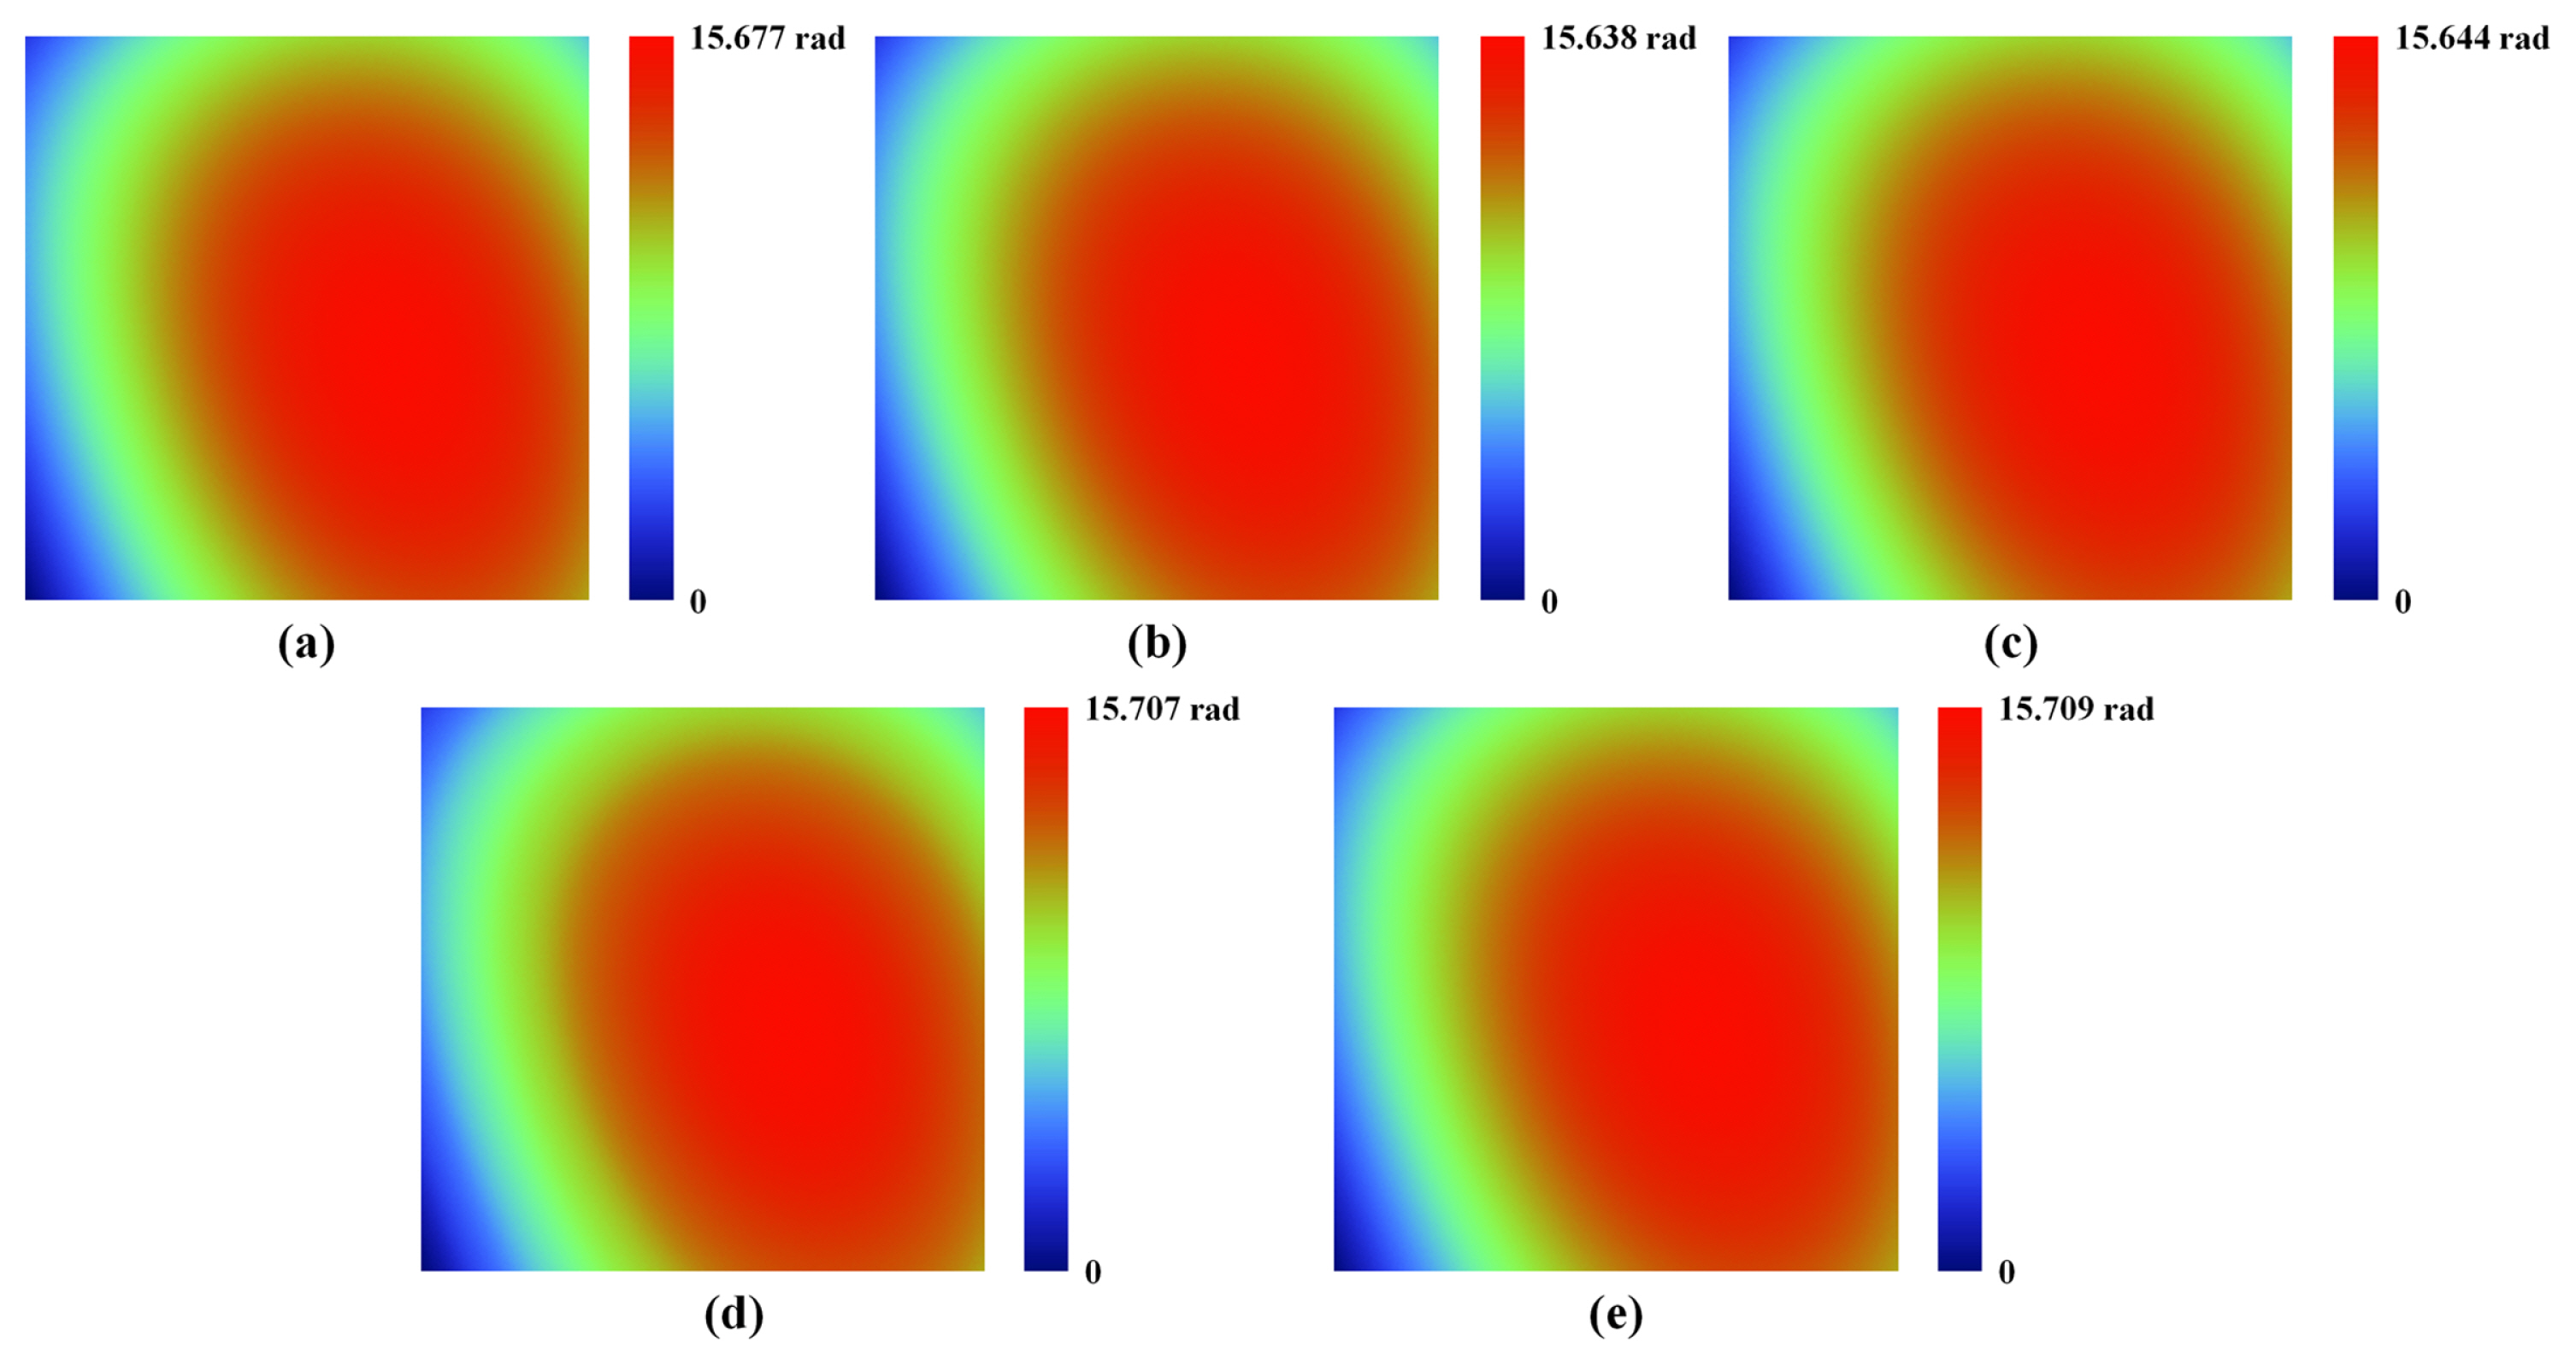
Fig.┬Ā6
Wavelength-modulated Fizeau interferometer for surface measurement of the glass plate. BS, QWP, and PBS indicate the beam splitter, quarter-wave plate, and polarized beam splitter, respectively 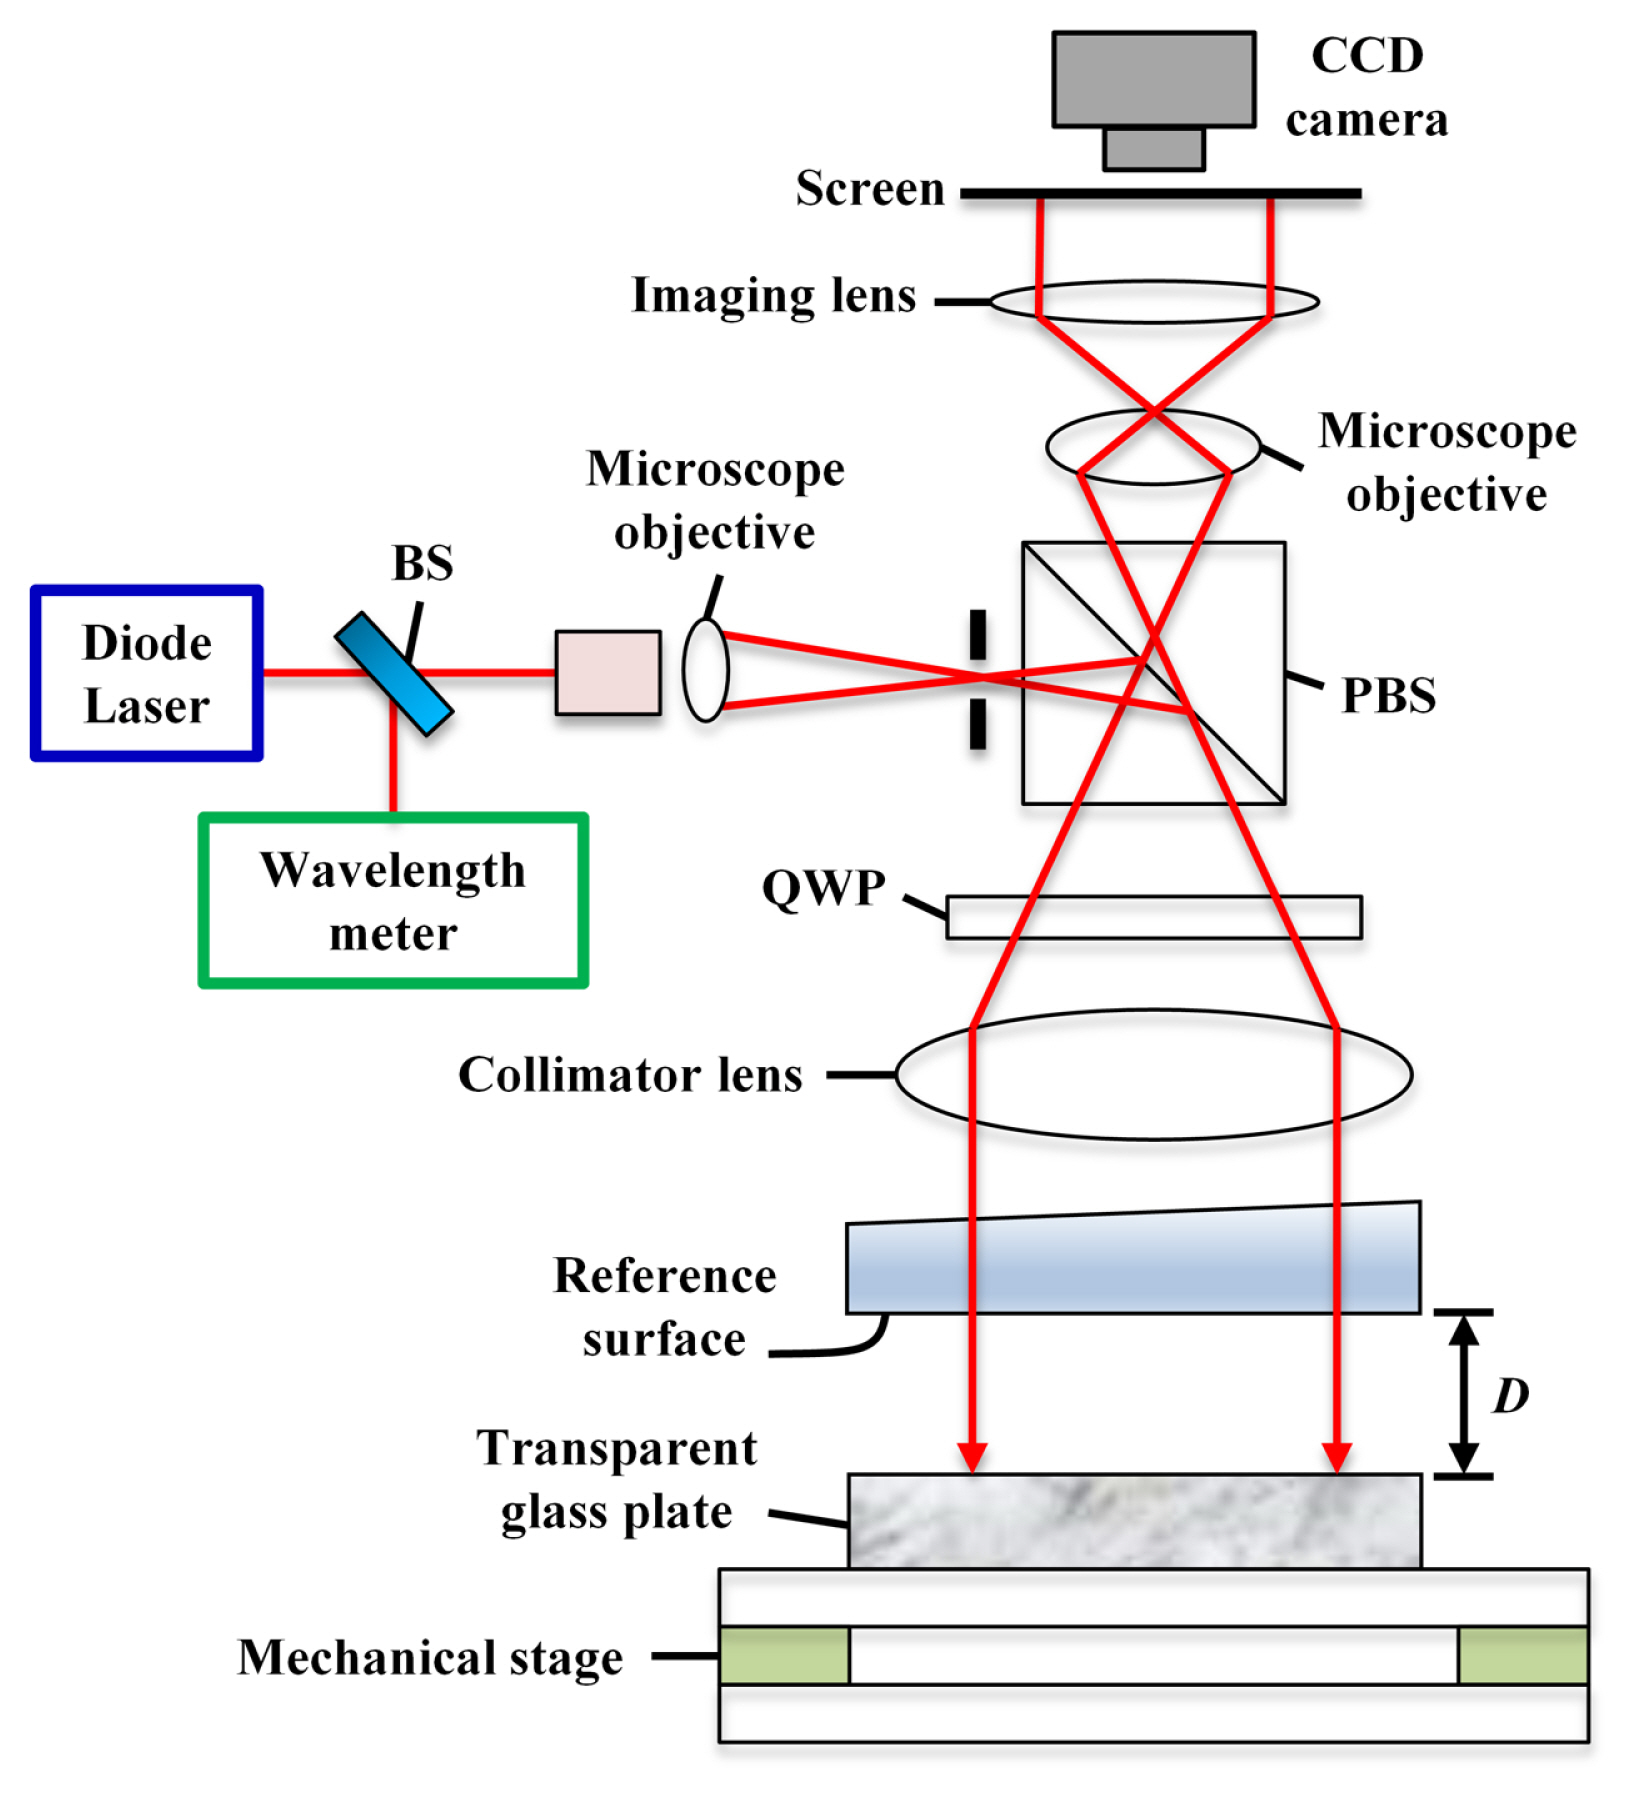
Fig.┬Ā7
Transparent glass plate on the mechanical stage 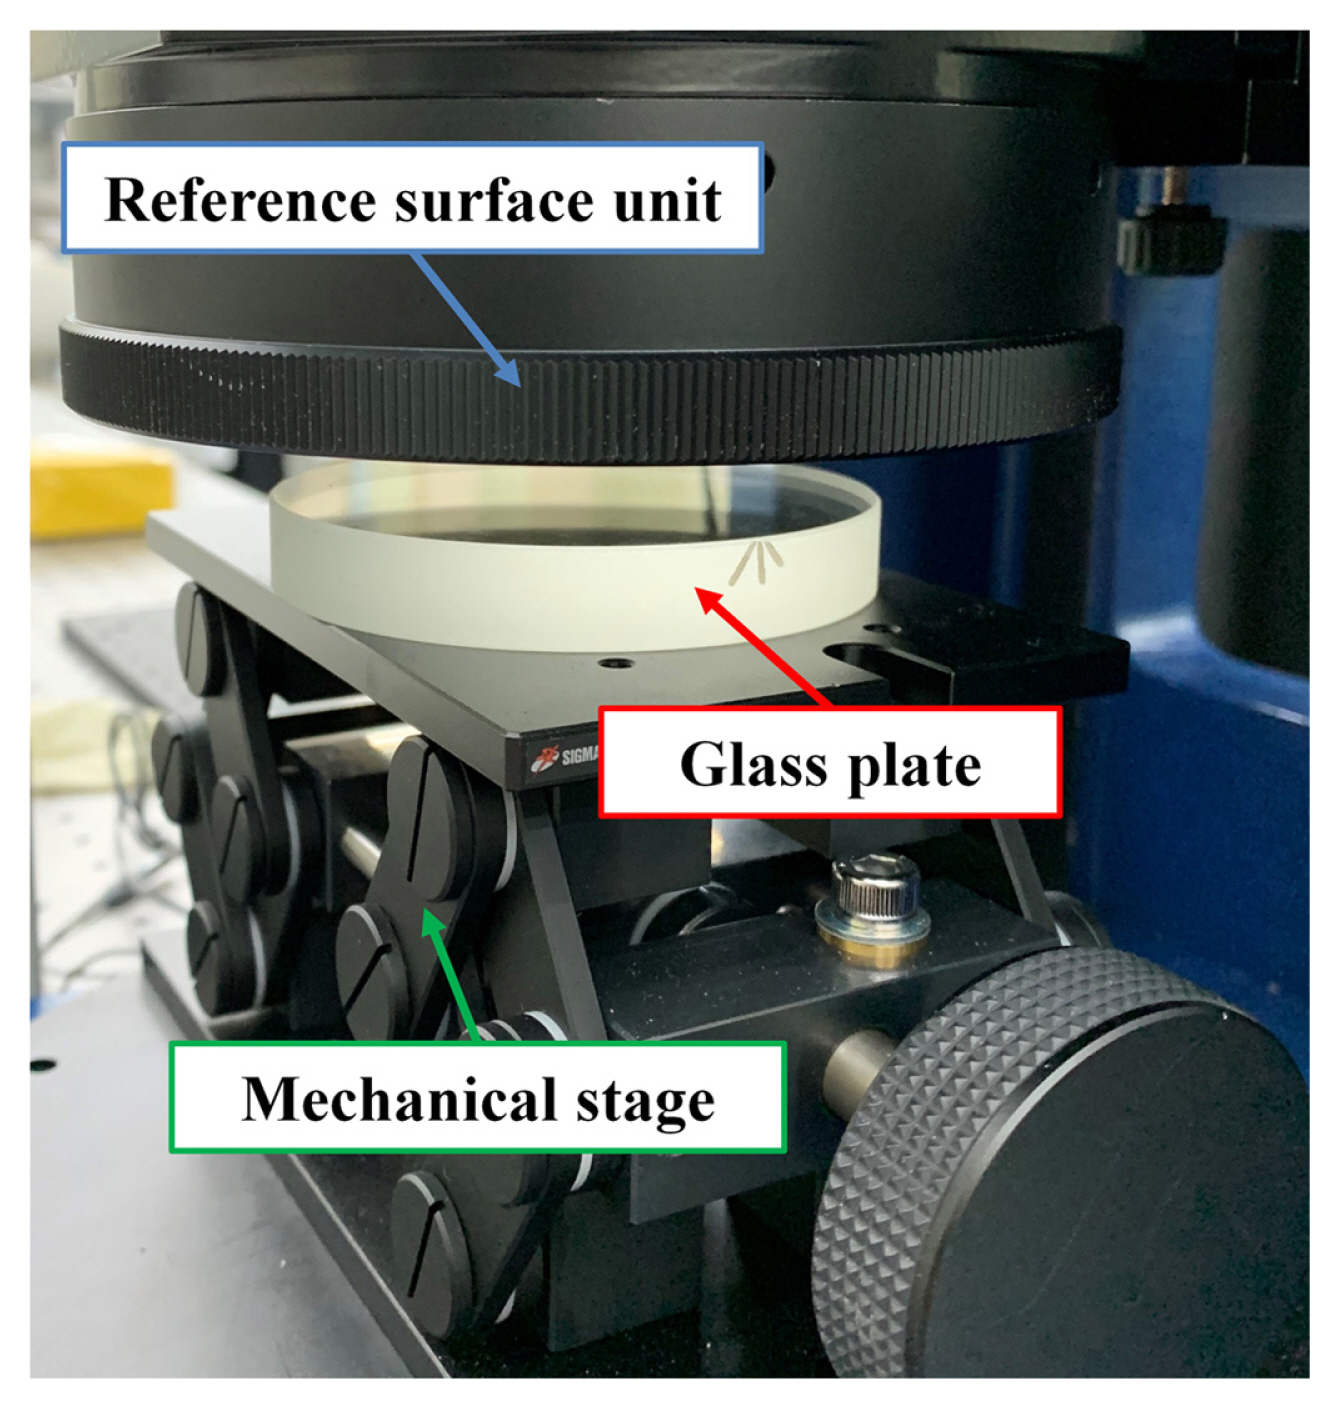
Fig.┬Ā8
Raw interferogram of transparent glass plate at ╬╗ = 632.9 nm 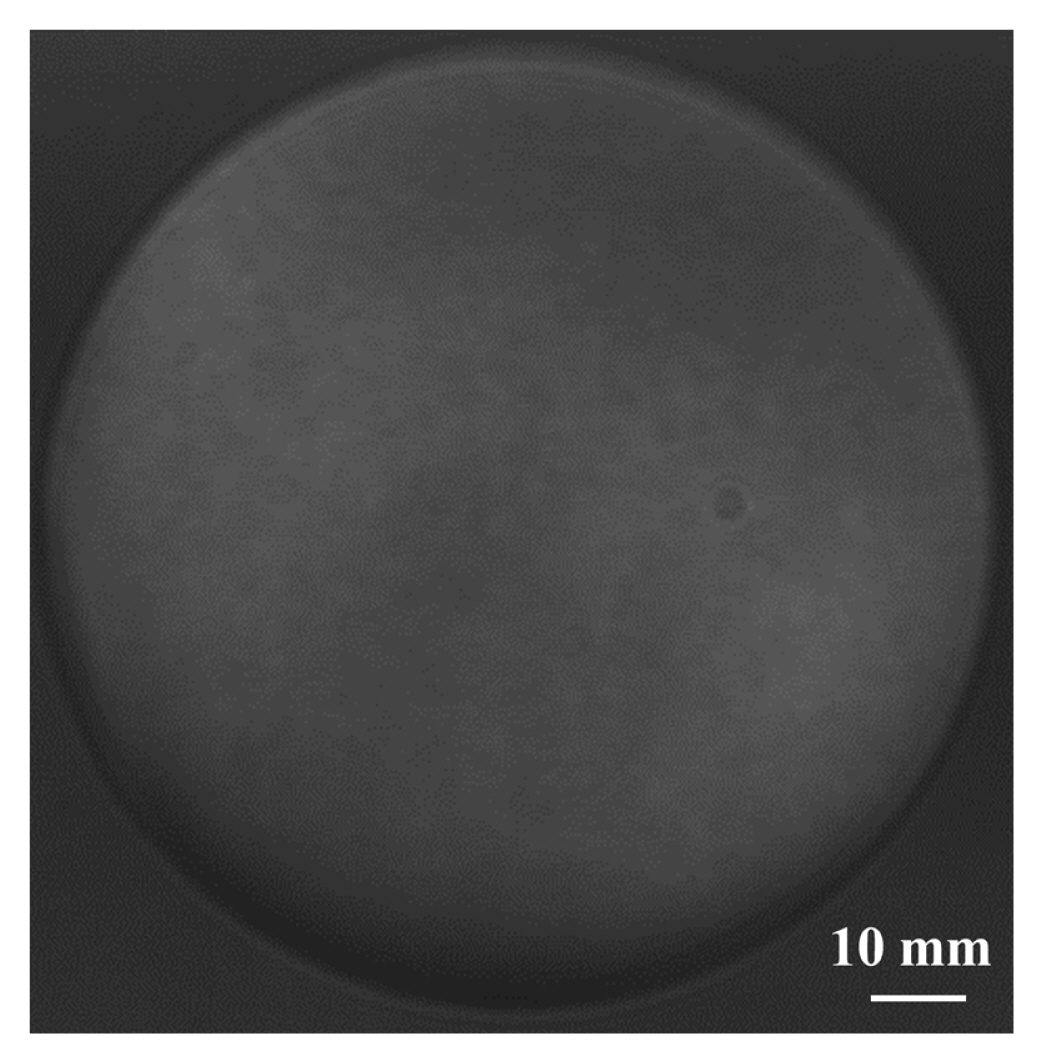
Fig.┬Ā9
Five experimental interferograms of transparent glass plate obtained using wavelength-modulated Fizeau interferometer 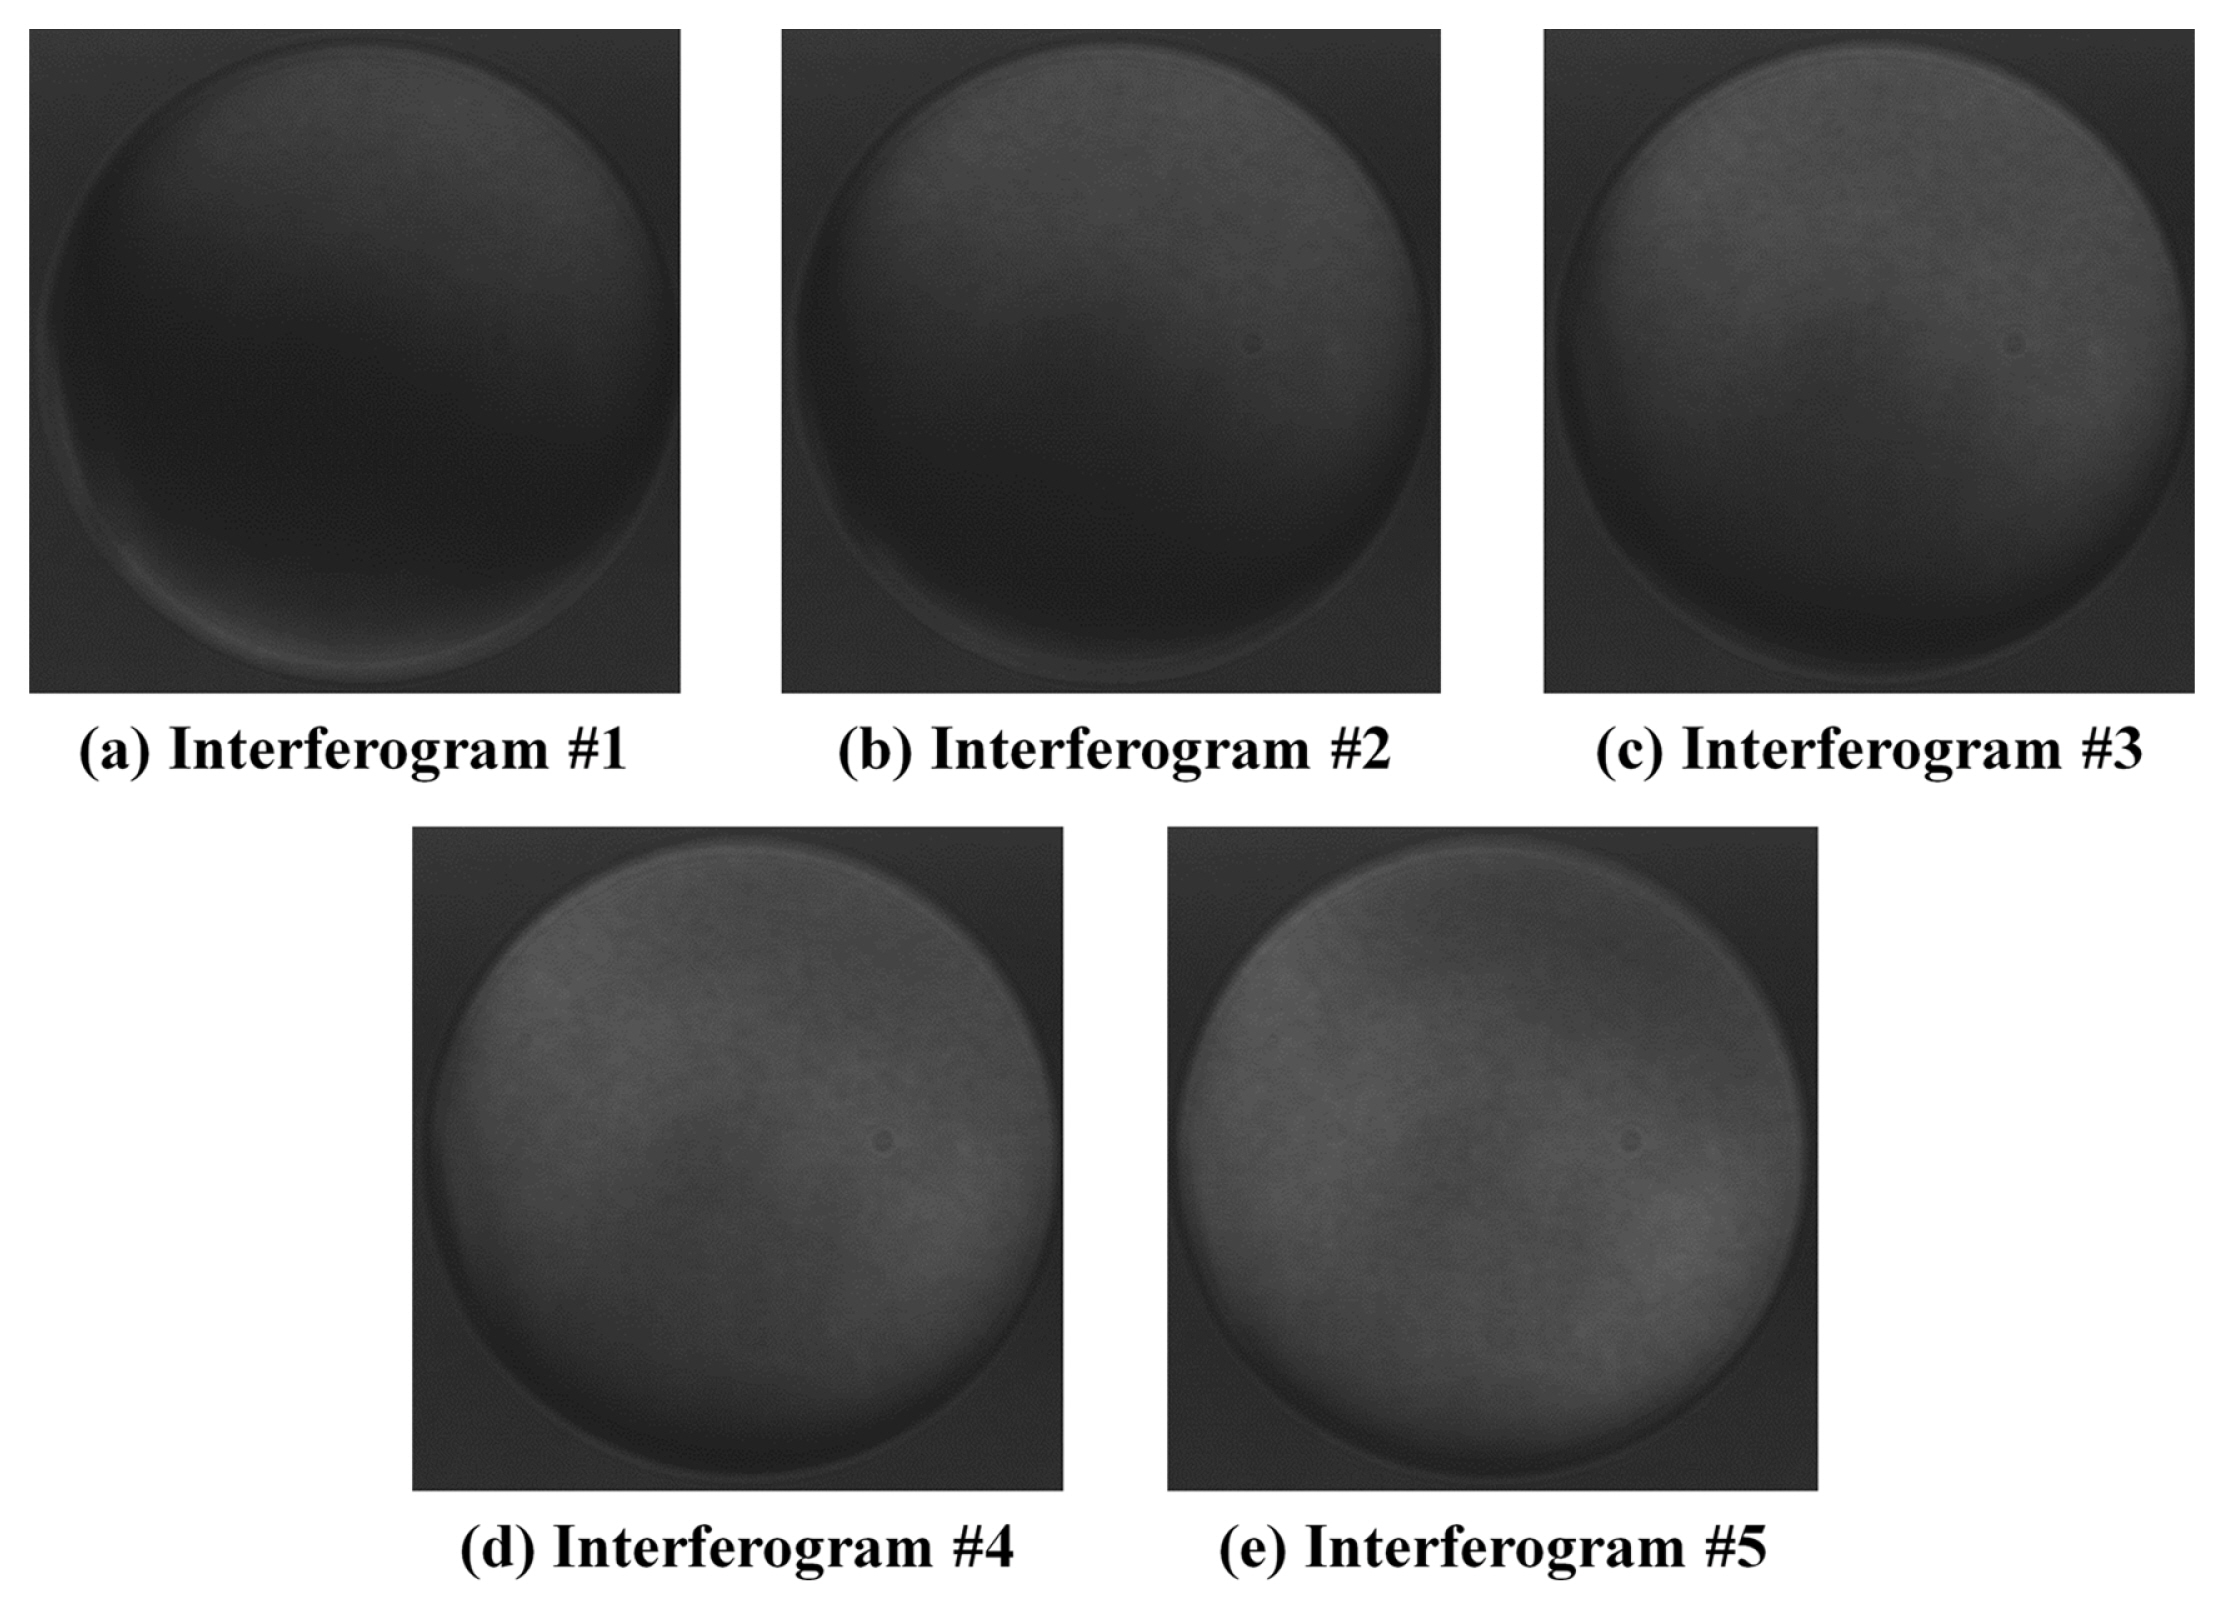
Fig.┬Ā10
Surface of transparent glass plate obtained by using five-frame harmonic phase-iterative method and wavelength-modulated interferometry 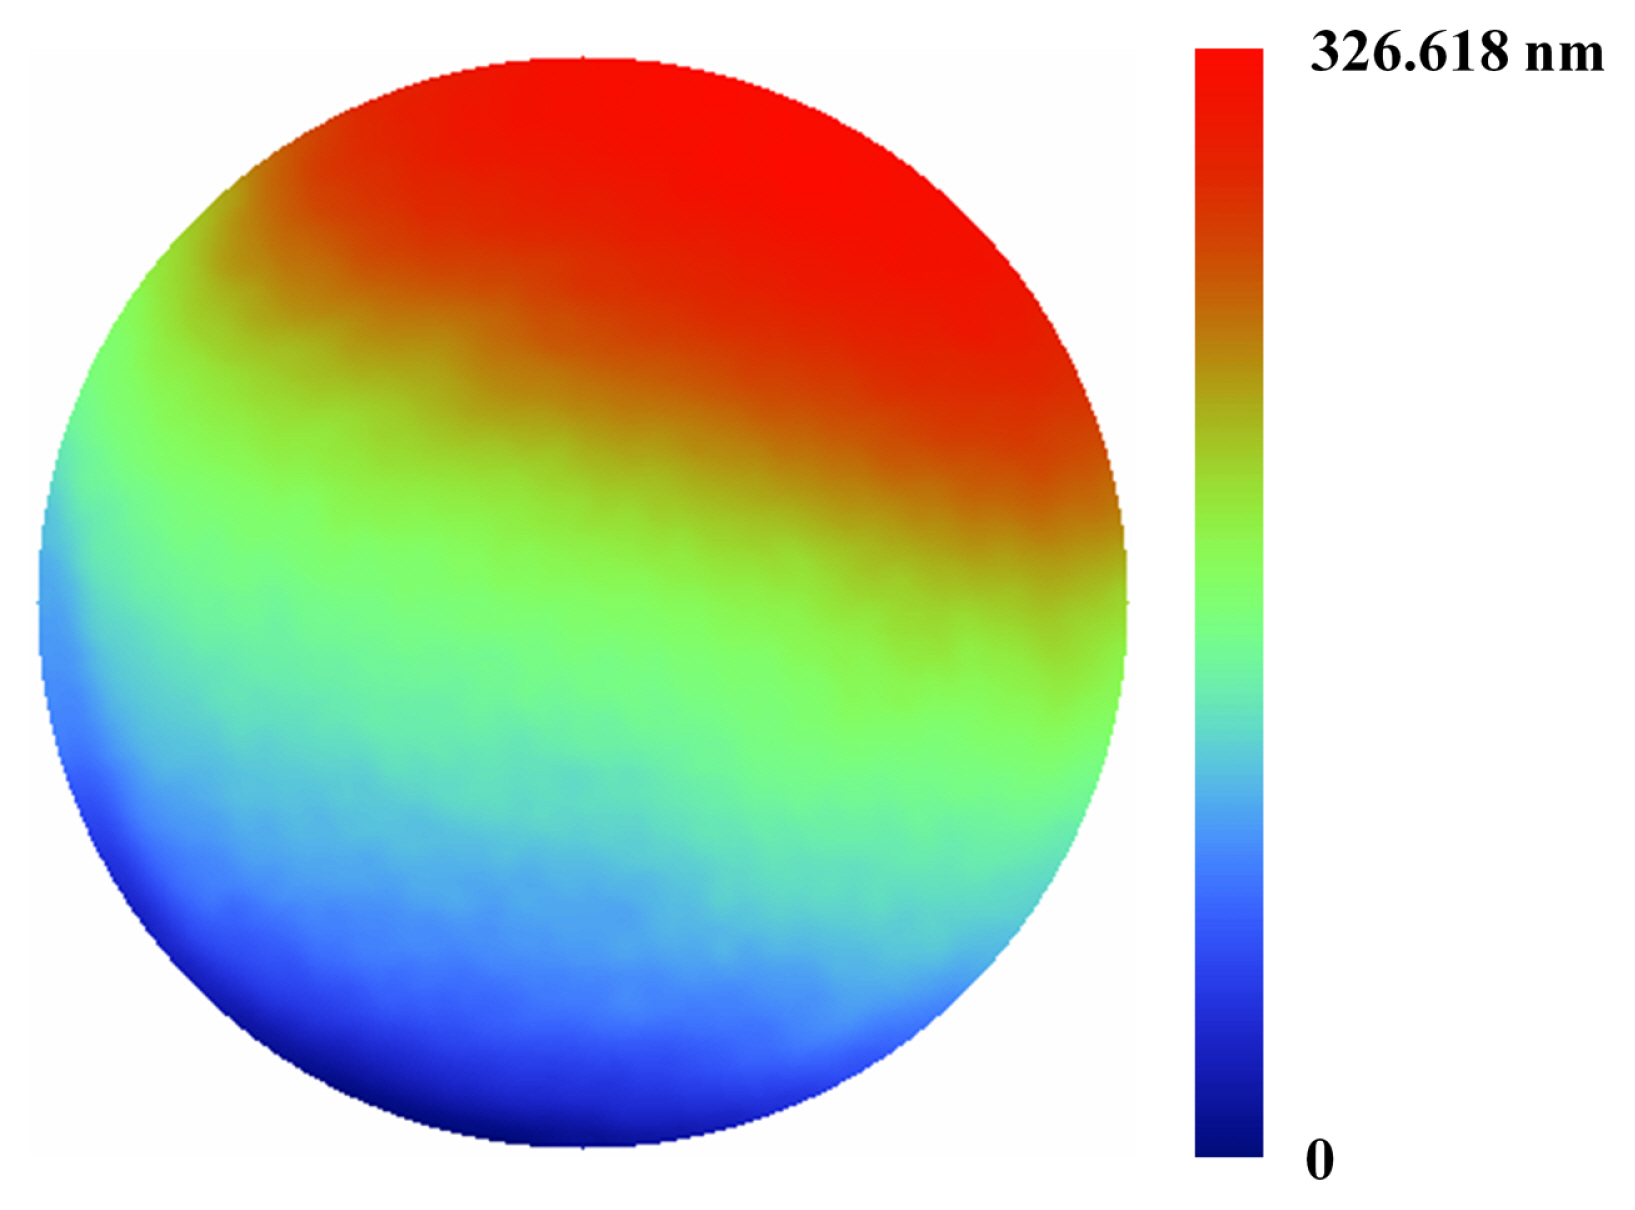
Fig.┬Ā11
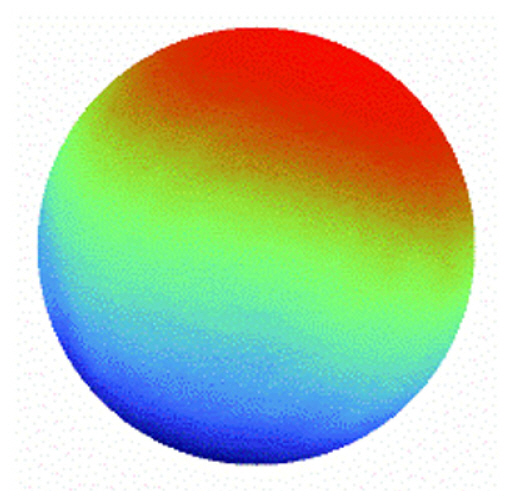
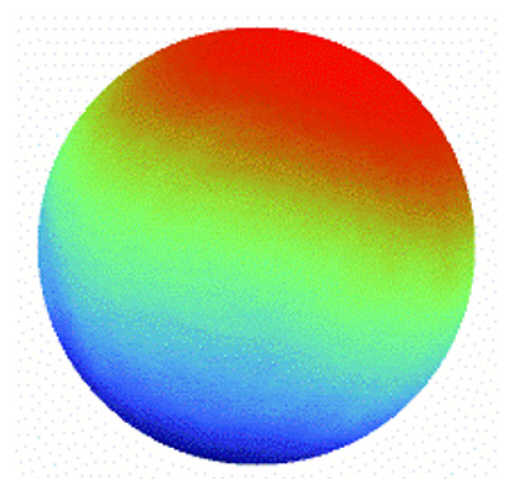
Surface of the transparent glass plate calculated by (a) HPIA, (b) AIA, and (c) XuŌĆÖs PIA; surface profile (d) at the 200th column and (e) at the 200th row 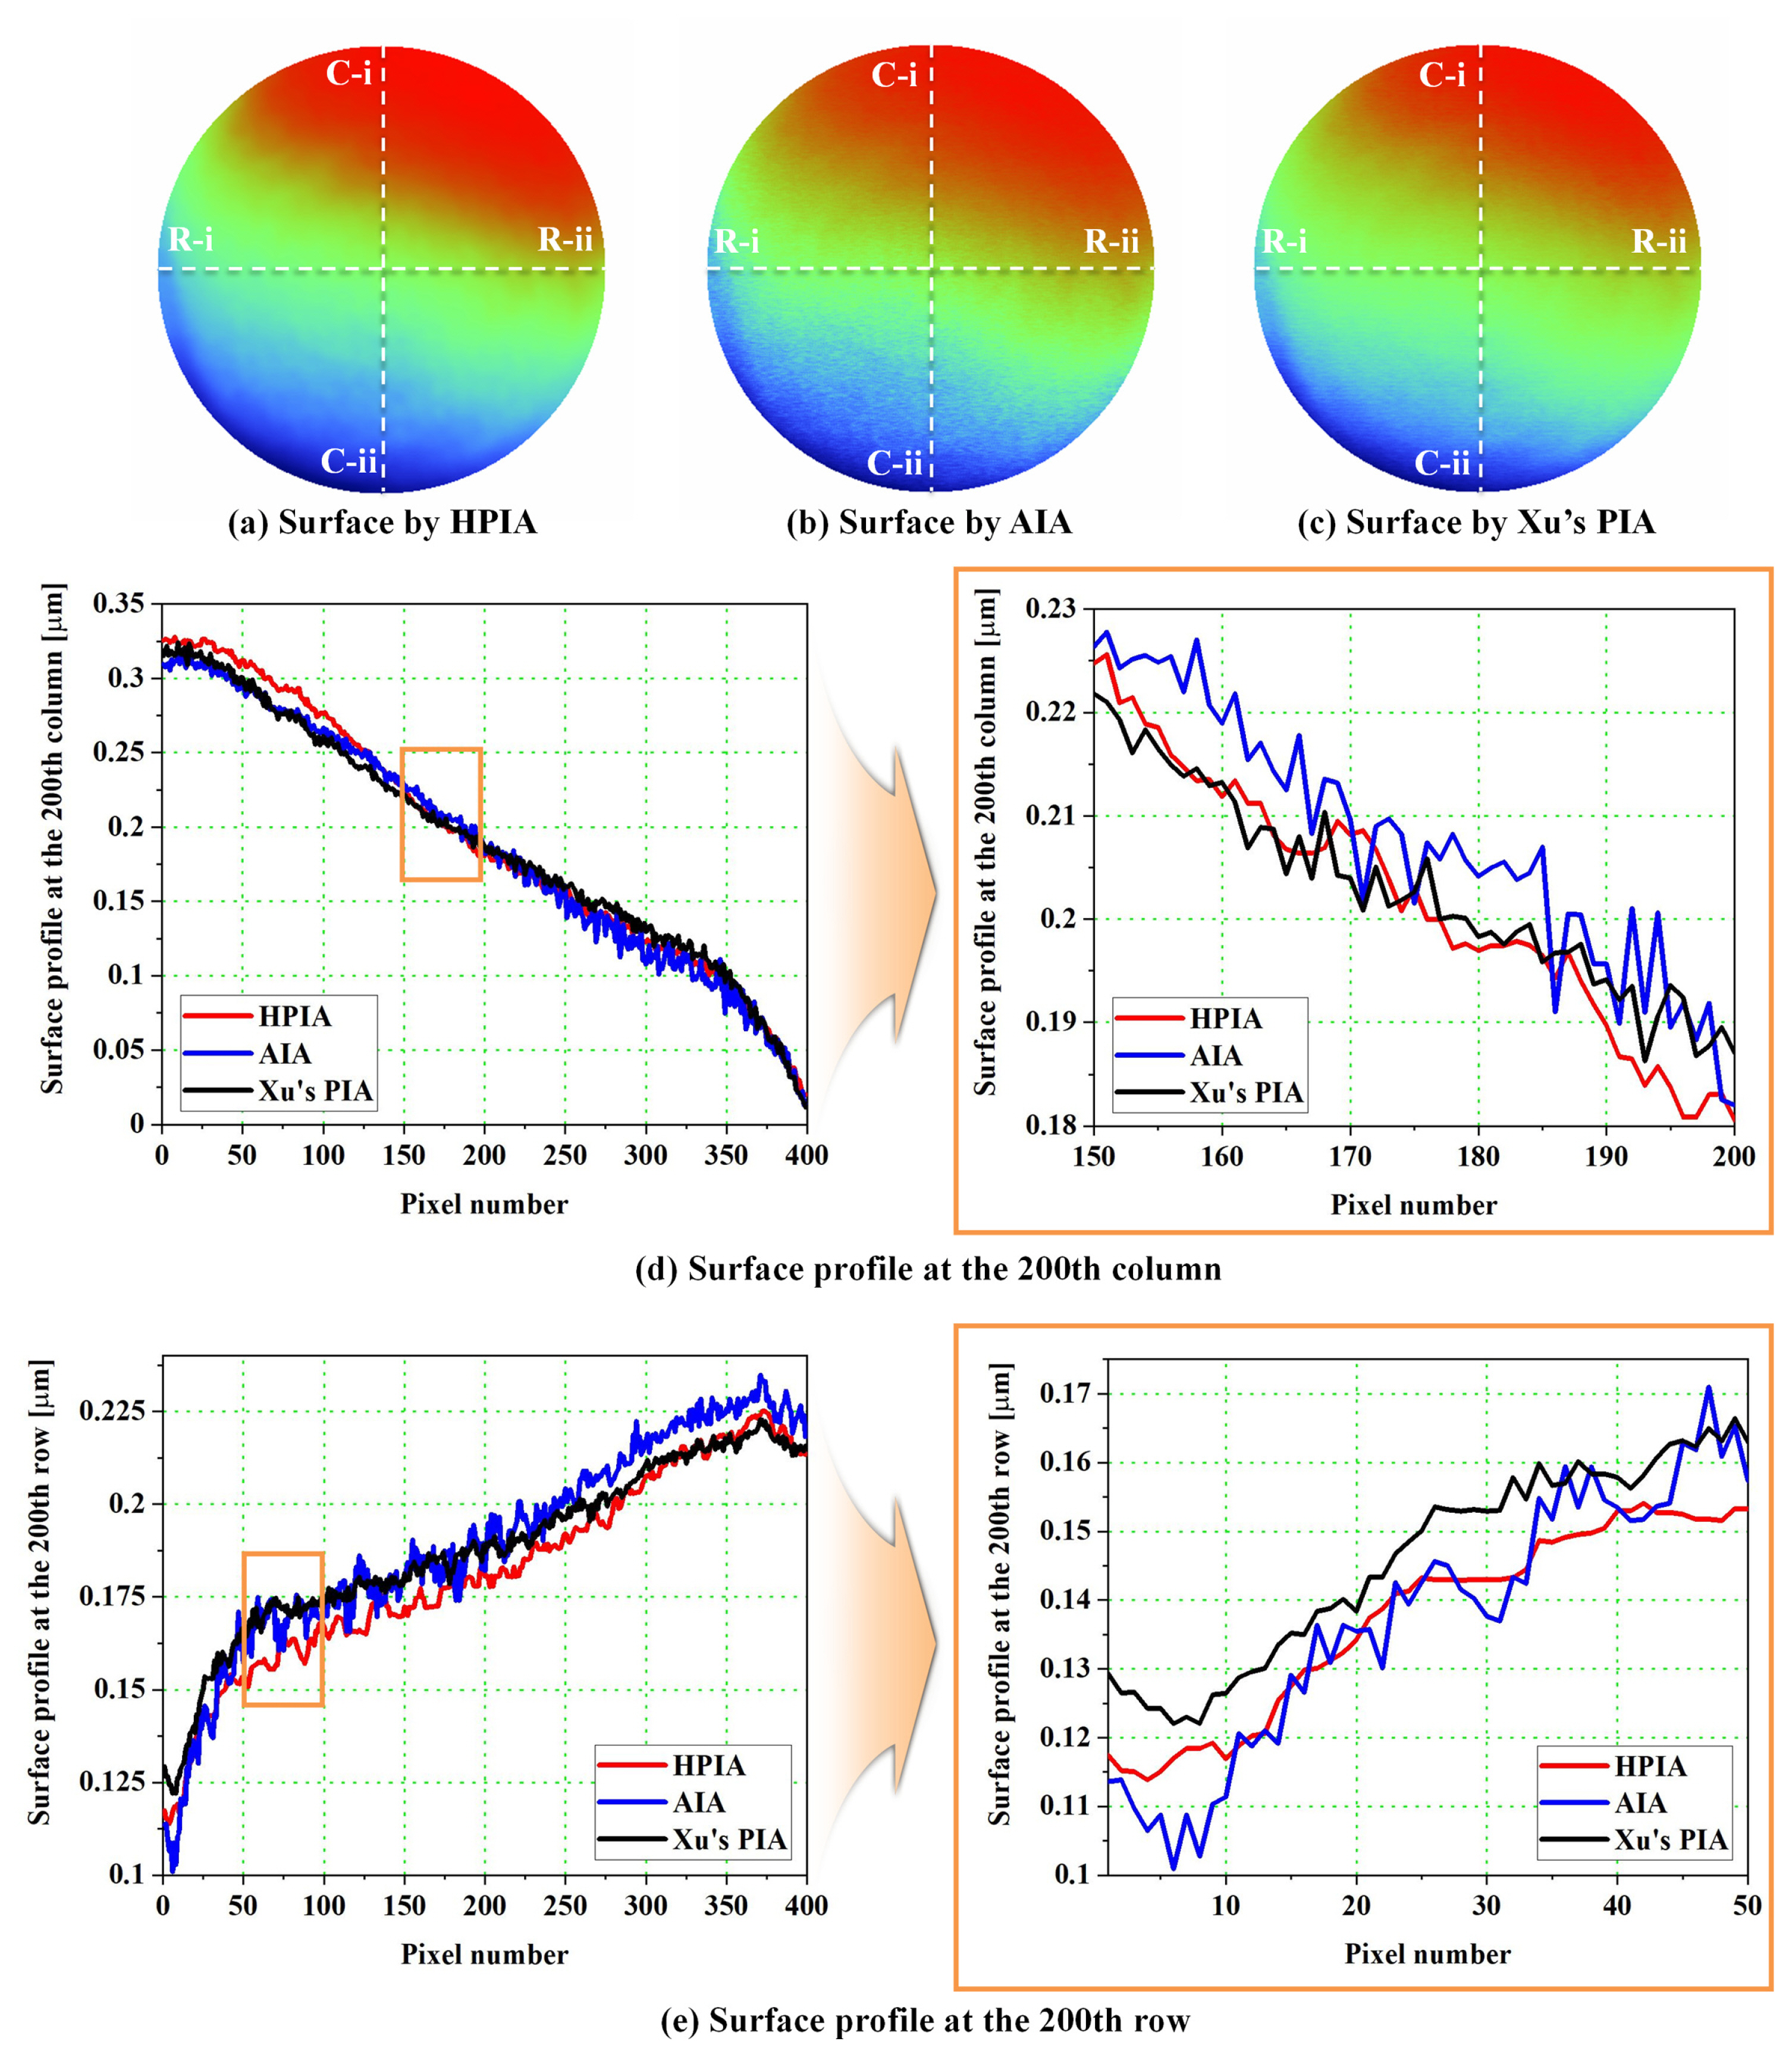
Fig.┬Ā12
Surface of the transparent glass plate calculated by (a) HPIA, (b) four-frame PTA [ 27] Adapted from Ref. 27 on the basis of OA, and (c) five-frame PTA [ 28, 29] Adapted from Refs. 28, 29 on the basis of OA; surface profile (d) at the 200th column and (e) at the 200th row 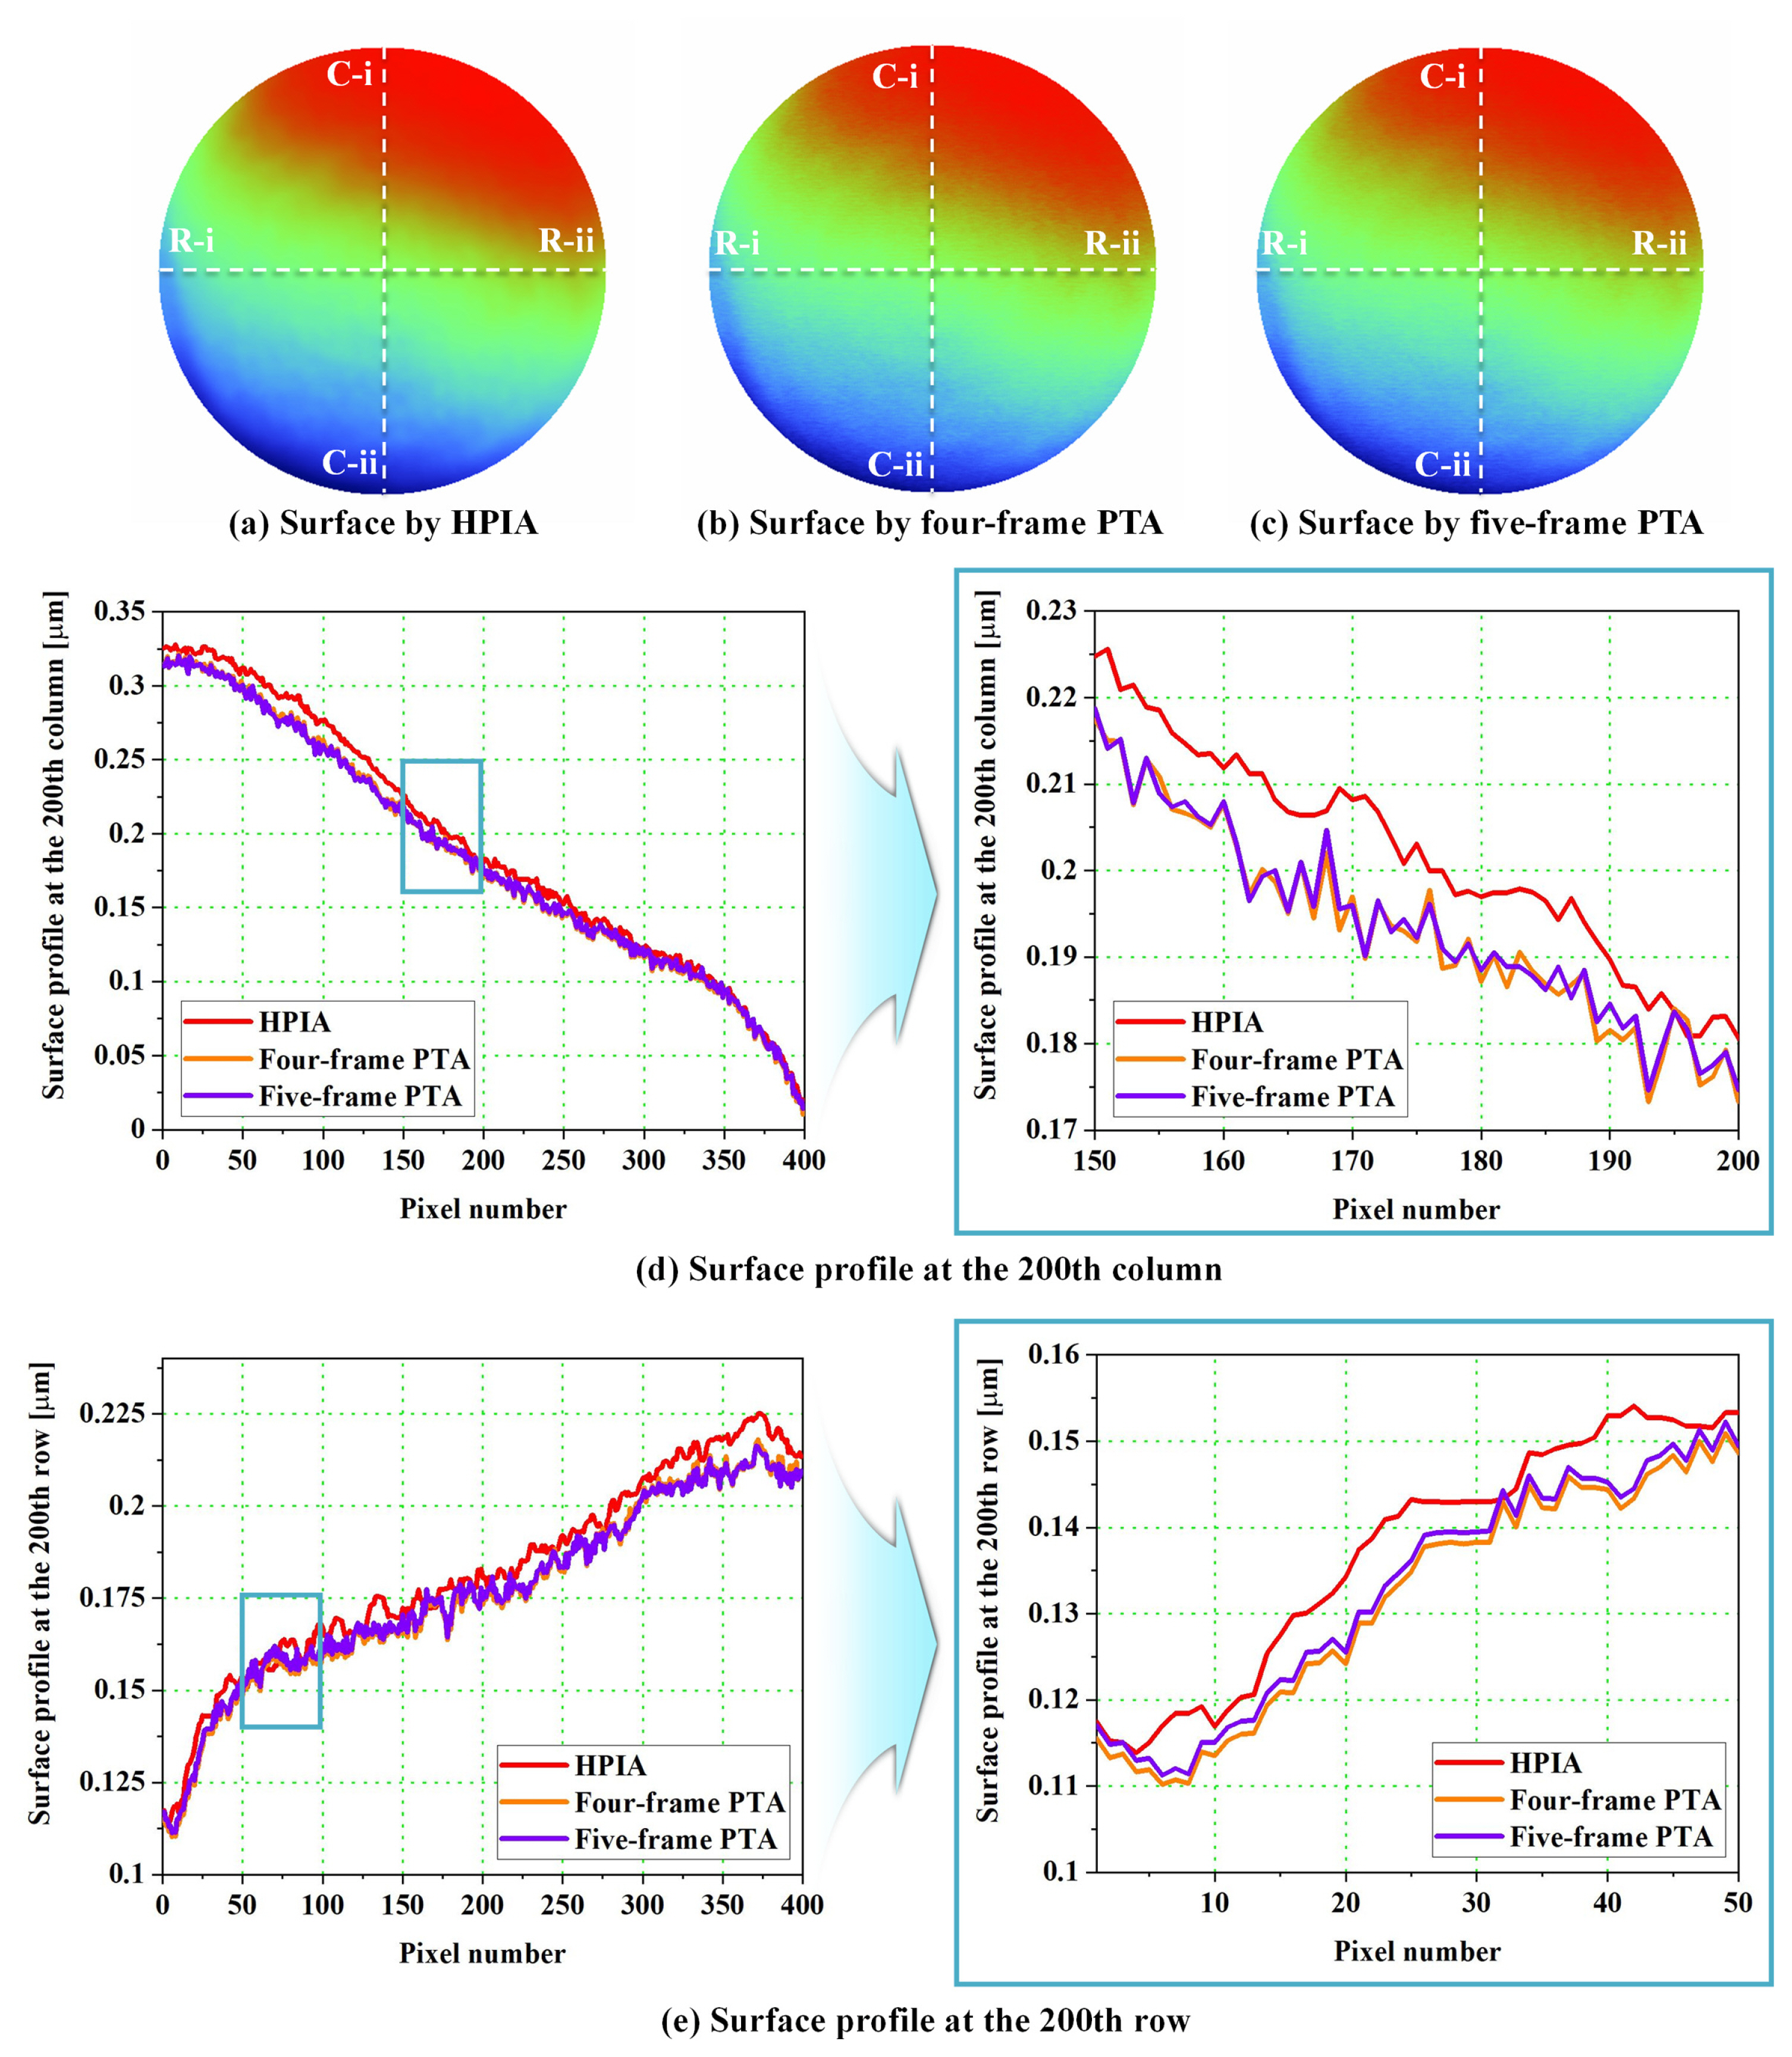
Table┬Ā1
Phase-extraction methods for estimating the performance of the phase-extraction ability
|
Phase-extraction methods |
Number of frames (M) |
Reference |
|
Harmonic phase-iterative algorithm (HPIA) |
5 |
- |
|
Advanced iterative algorithm (AIA) |
5 |
18
|
|
XuŌĆÖs phase-iterative algorithm (XuŌĆÖs PIA) |
5 |
19
|
|
Four-frame phase-tuning algorithm (Four-frame PTA) |
4 |
27
|
|
Five-frame phase-tuning algorithm (Five-frame PTA) |
5 |
28, 29
|
Table┬Ā2
RMS phase errors of phase-extraction methods in numerical simulation
|
Phase-extraction methods |
RMS phase error (rad) |
|
HPIA |
0.115 |
|
AIA |
0.167 |
|
XuŌĆÖs PIA |
0.158 |
|
Four-frame PTA |
0.285 |
|
Five-frame PTA |
0.212 |
References
1. Yu, E., Kim, S. C., Lee, H. J., Oh, K. H. & Moon, M. W. (2015). Extreme wettability of nanostructured glass fabricated by non-lithographic, anisotropic etching. Scientific Reports, 5(1), 1ŌĆō6.     2. de Groot, P., Biegen, J., Clark, J., de Lega, X. C. & Grigg, D. (2002). Optical interferometry for measurement of the geometric dimensions of industrial parts. Applied Optics, 41(19), 3853ŌĆō3860. 3. Conroy, M., & Armstrong, J. (2005). A comparison of surface metrology techniques. Proceeding of the Journal of Physics: Conference Series, 13(1), 106. 4. Wang, Y., Xie, F., Ma, S. & Dong, L. (2017). Review of surface profile measurement techniques based on optical interferometry. Optics and Lasers in Engineering, 93, 164ŌĆō170. 5. De Groot, P., (2000). Measurement of transparent plates with wavelength-tuned phase-shifting interferometry. Applied Optics, 39(16), 2658ŌĆō2663. 6. Hibino, K., Oreb, B. F., Fairman, P. S. & Burke, J. (2004). Simultaneous measurement of surface shape and variation in optical thickness of a transparent parallel plate in wavelength-scanning Fizeau interferometer. Applied Optics, 43(6), 1241ŌĆō1249. 7. Kim, S., Kim, Y., Shin, S. C., Hibino, K. & Sugita, N. (2021). Interferometric thickness measurement of glass plate by phase-shifting analysis using wavelength scanning with elimination of bias phase error. Optical Review, 28(1), 48ŌĆō57. 8. Chang, L., He, T., Wang, C. & Yu, Y. (2022). Multi-surface phase-shifting interferometry using harmonic frequency solution based on the total least squares. Optics and Lasers in Engineering, 150, 106845. 9. Deck, L. L., (2014). Model-based phase shifting interferometry. Applied Optics, 53(21), 4628ŌĆō4636. 10. Hibino, K., Oreb, B. F., Farrant, D. I. & Larkin, K. G. (1995). Phase shifting for nonsinusoidal waveforms with phase-shift errors. JOSA A, 12(4), 761ŌĆō768. 11. Hibino, K., Oreb, B. F., Farrant, D. I. & Larkin, K. G. (1997). Phase-shifting algorithms for nonlinear and spatially nonuniform phase shifts. JOSA A, 14(4), 918ŌĆō930. 12. Hibino, K., Kim, Y., Lee, S., Kondo, Y., Sugita, N. & Mitsuishi, M. (2012). Simultaneous measurement of surface shape and absolute optical thickness of a glass plate by wavelength tuning phase-shifting interferometry. Optical Review, 19(4), 247ŌĆō253. 13. Creath, K., (1988). V phase-measurement interferometry techniques. Progress in Optics, 26, 349ŌĆō393. 14. Zhou, Y., Fan, D., Fan, S., Chen, Y. & Liu, G. (2016). Laser scanning by rotating polarization gratings. Applied Optics, 55(19), 5149ŌĆō5157. 15. Moschetti, G., Forbes, A., Leach, R. K., Jiang, X. & OŌĆÖConnor, D. (2016). Phase and fringe order determination in wavelength scanning interferometry. Optics Express, 24(8), 8997ŌĆō9012. 16. Kim, Y., & Hibino, K. (2017). Statistical and interferometric determination of the optical thickness of a multilayer transparent plate. Optical Review, 24(6), 734ŌĆō740. 17. Bae, W., & Kim, Y. (2021). Phase extraction formula for glass thickness measurement using Fizeau interferometer. Journal of Mechanical Science and Technology, 35(4), 1623ŌĆō1632. 18. Wang, Z., & Han, B. (2004). Advanced iterative algorithm for phase extraction of randomly phase-shifted interferograms. Optics Letters, 29(14), 1671ŌĆō1673. 19. Xu, J., Xu, Q. & Chai, L. (2008). An iterative algorithm for interferograms with random phase shifts and high-order harmonics. Journal of Optics A: Pure and Applied Optics, 10(9), 095004. 20. Jin, C., Li, D., Kewei, E., Li, M., Chen, P., Wang, R. & Xiong, Z. (2018). Phase extraction based on iterative algorithm using five-frame crossed fringes in phase measuring deflectometry. Optics and Lasers in Engineering, 105, 93ŌĆō100. 21. Zhang, Y., Tian, X. & Liang, R. (2019). Timesaving phase retrieval approach based on difference map normalization and fast iterative algorithm. Optics and Lasers in Engineering, 121, 18ŌĆō28. 22. Surrel, Y., (1996). Design of algorithms for phase measurements by the use of phase stepping. Applied Optics, 35(1), 51ŌĆō60. 23. Kim, Y., Hibino, K., Sugita, N. & Mitsuishi, M. (2016). Interferometric measurement of surface shape by wavelength tuning suppressing random intensity error. Applied Optics, 55(23), 6464ŌĆō6470. 24. Miao, F., Ahn, S., Moon, Y. H. & Kim, Y. (2019). Surface profilometry of silicon wafers using wavelength-tuned phase-shifting interferometry. Journal of Mechanical Science and Technology, 33(11), 5327ŌĆō5335. 25. Zhu, W., Fokoua, E. N., Chen, Y., Bradley, T., Petrovich, M. N., Poletti, F., Zhao, M., Richardson, D. J. & Slav├Łk, R. (2019). Temperature insensitive fiber interferometry. Optics Letters, 44(11), 2768ŌĆō2770. 26. Mun, J. I., Jo, T., Kim, T. & Pahk, H. J. (2015). Residual vibration reduction of white-light scanning interferometry by input shaping. Optics Express, 23(1), 464ŌĆō470. 27. Bruning, J. H., Herriott, D. R., Gallagher, J. E., Rosenfeld, D. P., White, A. D. & Brangaccio, D. J. (1974). Digital wavefront measuring interferometer for testing optical surfaces and lenses. Applied Optics, 13(11), 2693ŌĆō2703. 28. Schwider, J., Burow, R., Elssner, K.-E., Grzanna, J., Spolaczyk, R. & Merkel, K. (1983). Digital wave-front measuring interferometry: Some systematic error sources. Applied Optics, 22(21), 3421ŌĆō3432. 29. Hariharan, P., Oreb, B. F. & Eiju, T. (1987). Digital phase-shifting interferometry: A simple error-compensating phase calculation algorithm. Applied Optics, 26(13), 2504ŌĆō2506. 30. Kim, Y., Hibino, K., Sugita, N. & Mitsuishi, M. (2015). Measurement of optical thickness variation of BK7 plate by wavelength tuning interferometry. Optics Express, 23(17), 22928ŌĆō22938. 31. Zhu, L., Sun, P.-C., Bartsch, D.-U., Freeman, W. R. & Fainman, Y. (1999). Wave-front generation of Zernike polynomial modes with a micromachined membrane deformable mirror. Applied Optics, 38(28), 6019ŌĆō6026. 32. Liu, K., & Littman, M. G. (1981). Novel geometry for single-mode scanning of tunable lasers. Optics Letters, 6(3), 117ŌĆō118.
Biography
Sungtae Kim received his B.S. degree at the School of Mechanical Engineering, Pusan National University in 2019. He is Ph.D. candidate at the School of Mechanical Engineering, Pusan National University. His research interests include precision measurement using wavelength-modulated Fizeau interferometer and fringe analysis using iterative algorithm.
Biography
Yangjin Kim received his B.S. and Ph.D. degrees at the Department of Mechanical Engineering, the University of Tokyo, in 2007 and 2015, respectively. He was a professional research personnel at the Korea Institute of Machinery and Materials (KIMM) from 2009 to 2012 as a military service. He is an Associate Professor at the School of Mechanical Engineering, Pusan National University. His research interests include precision measurement using wavelength-modulated Fizeau interferometer and fringe analysis using phase modulating.
Biography
Naohiko Sugita received his M.S. and Ph.D. degrees at the Department of Mechanical Engineering, The University of Tokyo, in 1996 and 2005, respectively. He was with NEC, Tokyo, Japan, from 1996 to 2003. He was also a Research Associate and an Associate Professor with The University of Tokyo, in 2003 and 2007, respectively. His research interests include the machining of biomaterials, robot-assisted surgical systems, and intelligent manufacturing systems.
Biography
Mamoru Mitsuishi received his M.S. and D.E. degrees at the Department of Mechanical Engineering, the University of Tokyo, in 1983 and 1986, respectively. In 1986, he was a Lecturer with the University of Tokyo, where he was also an Associate Professor in 1989 and a Professor since 1999. From 1987 to 1988, he was a Visiting Researcher with the Fraunhofer Institute for Production Technique and Automation, Stuttgart, Germany. His research interests include computer integrated surgical systems and manufacturing systems. He is a member of the international academy for production engineering (CIRP, Fellow, and President from 2019 to 2021), the japan society of mechanical engineers (Fellow), the japan society for precision engineering, the robotic society of japan (Fellow), and IEEE robotics and automation society.
|
|
| TOOLS |
|
|
|
|
|
|
|
|
|
|
|
|
|
|
METRICS

|
|
|
|
|
|

 E-mail
 Print
Print facebook
 twitter
 Linkedin
 google+


 PDF Links
 PubReader
 Full text via DOI
 Download Citation
  CrossRef TDM


